

 Facebook
 X
X
 Pinterest
 Copy Link

Selling your house today isn’t about luck. It’s about strategy. The simple truth is homes with a good plan get offers. It’s the homes without one that just sit… and sit. That’s why you need an agent who knows how to nail every aspect of your sale. Don’t leave your move to chance. Contact me so you know what’s working for sellers in our area.
All •
March 12, 2026
Rates Move Higher
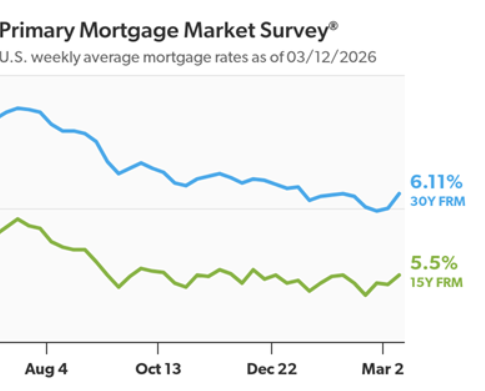
Freddie Mac (OTCQB: FMCC) today released the results of its Primary Mortgage Market Survey® (PMMS®), showing the 30-year fixed-rate mortgage (FRM) averaged 6.11%.
“The 30-year fixed-rate mortgage returned to last month’s level of 6.11%,” said Sam Khater, Freddie Mac’s Chief Economist. “Despite the modest uptick, buyers are responding to rates in this range, with existing-home sales increasing 1.7% in February. Purchase applications also increased this week, a welcome sign as buyers enter spring homebuying season with rates down more than half a percentage point compared to the same time last year.”
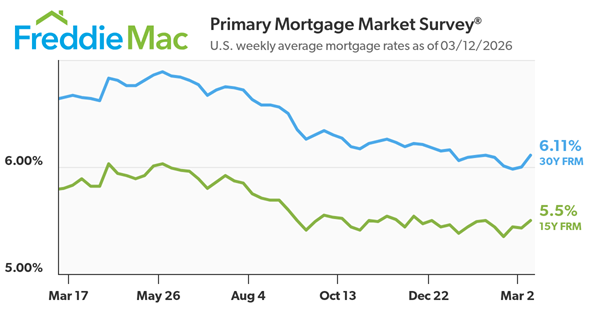
- The 30-year FRM averaged 6.11% as of March 12, 2026, up from last week when it averaged 6.00%. A year ago at this time, the 30-year FRM averaged 6.65%.
- The 15-year FRM averaged 5.50%, up from last week when it averaged 5.43%. A year ago at this time, the 15-year FRM averaged 5.80%.
The PMMS® is focused on conventional, conforming, fully amortizing home purchase loans for borrowers who put 20% down and have excellent credit.
All •
March 5, 2026
Mortgage Rates Hold Steady
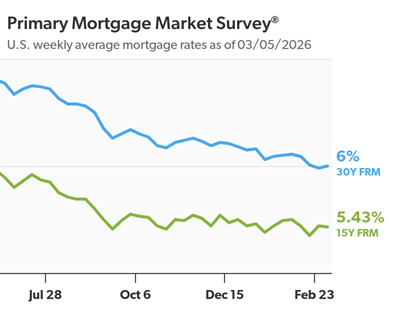
Freddie Mac (OTCQB: FMCC) today released the results of its Primary Mortgage Market Survey® (PMMS®), showing the 30-year fixed-rate mortgage (FRM) averaged 6.00%.
“Mortgage rates held steady at 6% this week, hovering near their lowest level since 2022,” said Sam Khater, Freddie Mac’s Chief Economist. “In fact, rates are down nearly a full percentage point from this time in 2024, spurring activity from buyers, sellers and owners. As a result, refinance activity is up, and purchase applications are ahead of last year’s pace.”
- The 30-year FRM averaged 6.00% as of March 5, 2026, slightly up from last week when it averaged 5.98%. A year ago at this time, the 30-year FRM averaged 6.63%.
- The 15-year FRM averaged 5.43%, slightly down from last week when it averaged 5.44%. A year ago at this time, the 15-year FRM averaged 5.79%.
The PMMS® is focused on conventional, conforming, fully amortizing home purchase loans for borrowers who put 20% down and have excellent credit.
All •
February 26, 2026
30-Year Fixed Averages 5.98%
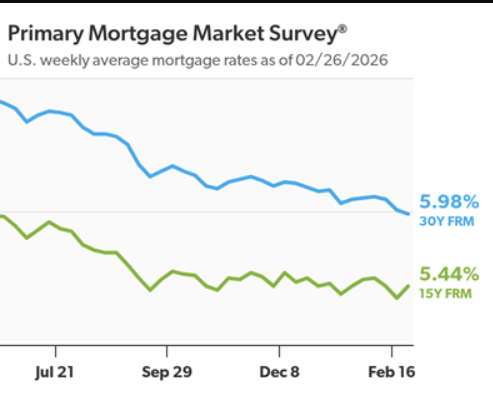
Freddie Mac today released the results of its Primary Mortgage Market Survey® (PMMS®), showing the 30-year fixed-rate mortgage (FRM) averaged 5.98%.
“For the first time in three and a half years, the 30-year fixed-rate mortgage dropped into the 5% range, falling even lower than last week’s milestone,” said Sam Khater, Freddie Mac’s Chief Economist. “This rate, combined with the improving availability of homes for sale, is meaningful and will drive more potential buyers into the market for spring homebuying season.”
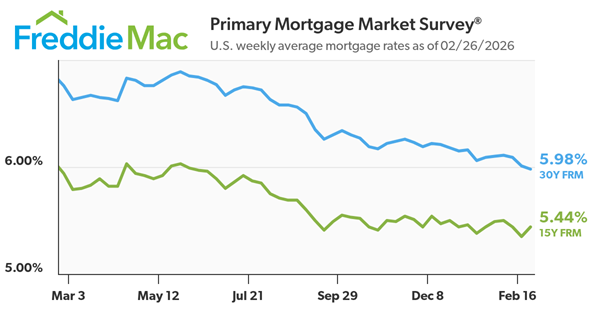
- The 30-year FRM averaged 5.98% as of February 26, 2026, down from last week when it averaged 6.01%. A year ago at this time, the 30-year FRM averaged 6.76%.
- The 15-year FRM averaged 5.44%, up from last week when it averaged 5.35%. A year ago at this time, the 15-year FRM averaged 5.94%.
The PMMS® is focused on conventional, conforming, fully amortizing home purchase loans for borrowers who put 20% down and have excellent credit.
Mortgage Rates Drop
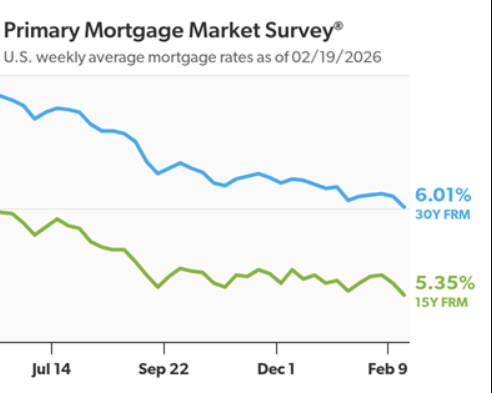
Freddie Mac (OTCQB: FMCC) today released the results of its Primary Mortgage Market Survey® (PMMS®), showing the 30-year fixed-rate mortgage (FRM) averaged 6.01%.
“Mortgage rates dropped again this week, now down to their lowest level since September of 2022,” said Sam Khater, Freddie Mac’s Chief Economist. “This lower rate environment is not only improving affordability for prospective homebuyers, it’s also strengthening the financial position of homeowners. Over the past year, refinance application activity has more than doubled, enabling many recent buyers to reduce their annual mortgage payments by thousands of dollars.”
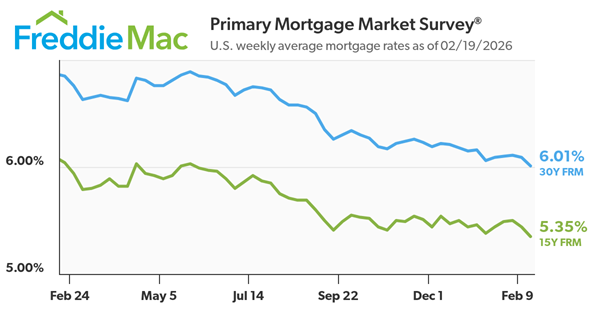
- The 30-year FRM averaged 6.01% as of February 19, 2026, down from last week when it averaged 6.09%. A year ago at this time, the 30-year FRM averaged 6.85%.
- The 15-year FRM averaged 5.35%, down from last week when it averaged 5.44%. A year ago at this time, the 15-year FRM averaged 6.04%.
The PMMS® is focused on conventional, conforming, fully amortizing home purchase loans for borrowers who put 20% down and have excellent credit.
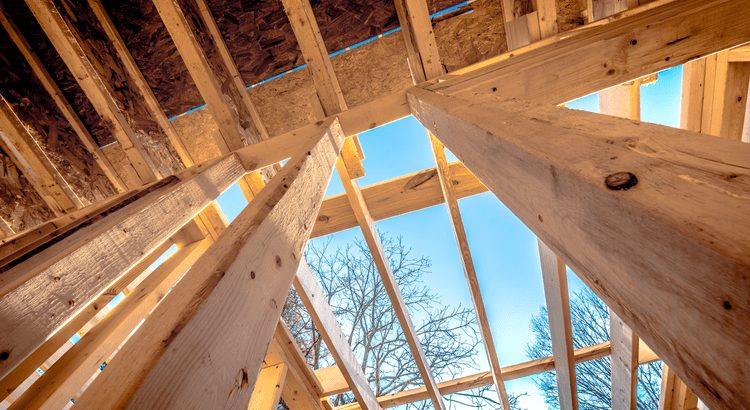
Move-Up Buyers Are Choosing New Construction
At some point, a house that once felt perfect just… doesn’t anymore.
Maybe you need more space.
Maybe working from home turned your dining room into a permanent office.
Maybe the layout just doesn’t match how you live now.
If your current house is starting to feel like it’s holding you back instead of supporting your life, it’s natural to think about making a move. But that brings up the next big question: once you sell, where do you go?
For a growing number of buyers, the answer is something brand new.
New Construction Is a More Popular Choice Lately
According to the National Association of Realtors (NAR), more people are buying new homes than they have in years. The latest annual data available shows 16% of homes purchased were newly built.
At first glance you may not see why that’s a big deal. But that’s actually the highest share of new home purchases in almost two decades.
Why More Buyers Are Choosing a Brand-New Construction
For many buyers, especially move-up buyers, new construction isn’t just about aesthetics. It’s about lifestyle, convenience, and peace of mind.
1. Everything Is Brand New
You’re not inheriting someone else’s projects. No wondering how old the roof is. No budgeting for a new HVAC right after move-in. No big surprises when the previous owners patch job fails. For move-up buyers who’ve been dumping money into updating their current house, that’s a win.
2. You Can Customize Before Move In
If you choose a home that’s still under construction, you could have the chance to pick the flooring, counters, cabinets, hardware, lighting, and so much more. That level of personalization can be a draw for move-up buyers like you, because it allows you to hand pick the fit and finishes you’ve been wanting for so long.
3. A Home Designed for How People Live Today
Most new construction homes are built to current building standards and buyer preferences, which means you could see built-in smart home features, better energy efficiency (which can lower utility bills), and even more modern floor plans and features. And if your layout just isn’t working for you anymore, you may find exactly what you need now in a new home.
4. Neighborhood Amenities
New developments often include shared community spaces like walking trails, parks, playgrounds, or even pools and gyms. For families and active households, that’s a big bonus to have that just a few steps out of their front door.
5. Builder Incentives
Not to mention, since there are more new homes on the market than the norm, builders are motivated to sell what they have. So, you may find they’re more willing to negotiate than you’d expect on things like price, upgrades, and more.
Bottom Line
If your current house isn’t meeting your needs anymore, don’t assume your only choice is an existing home. New construction is becoming a real contender, especially for move-up buyers who want space, features, and a home that works for how they live now.
Curious whether new construction might be a fit for you? Let’s chat.


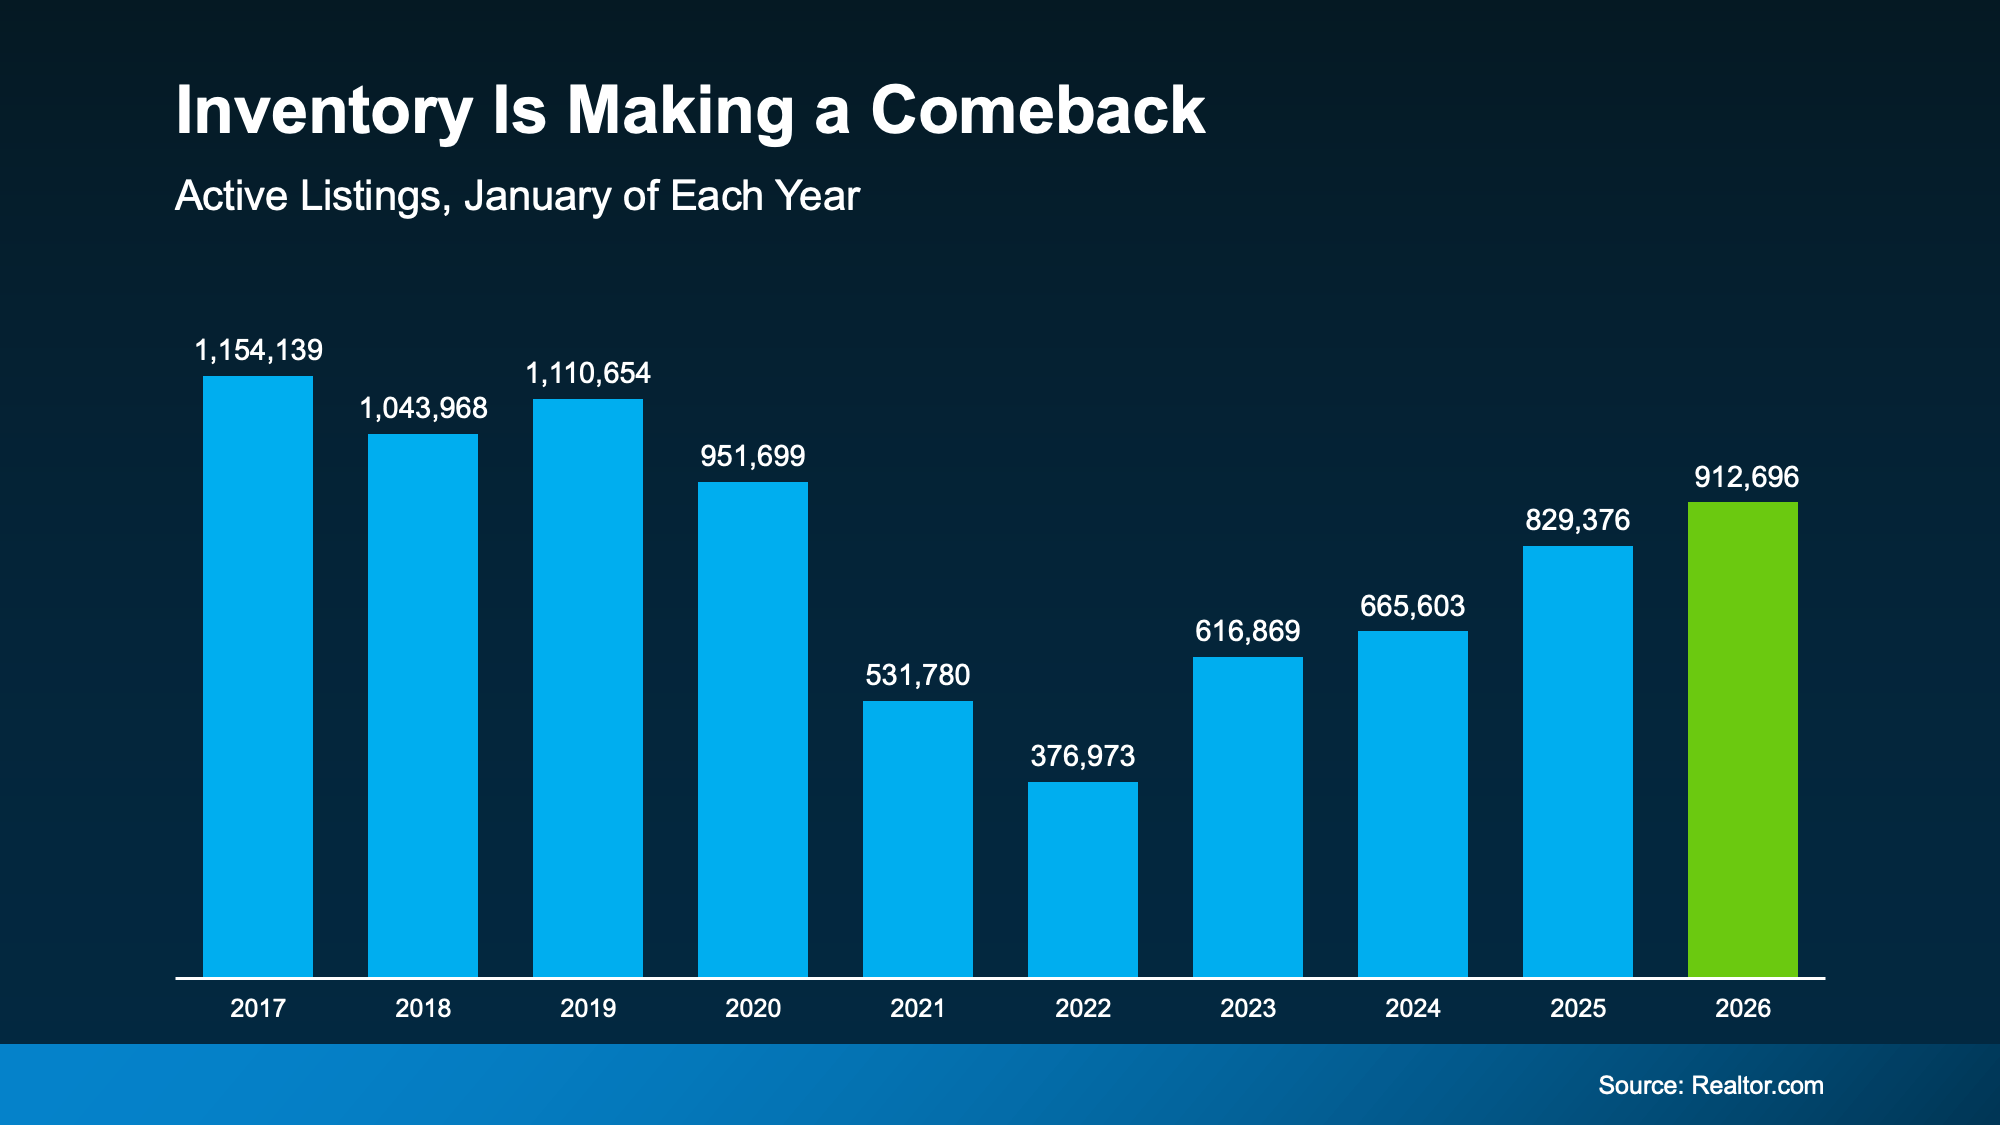
Is Inventory Making a Comeback

After a long stretch where buyers were competing for too few homes, inventory has made a comeback over the past year. And depending on where you live, that’s opening up your options in a meaningful way.
According to Realtor.com, the number of homes available for sale in January was the highest it’s been since 2020. Here’s why that’s such a big deal. Getting back to pre-pandemic levels signals a slow and steady return to what’s typical:
 Now, it’s worth noting, nationally we’re not there yet – and having more inventory improving won’t suddenly “fix” the market. But the growth we’ve seen lately still changes how competitive the market feels.
- When there are more homes for sale, buyers gain time, options, and leverage.
- When there aren’t, the pressure ramps up quickly.
In the years since 2020, there weren’t enough homes for sale, and that made the market feel different. Rushed. Stressful. Intimidating.
But now it’s finally getting better.
A Growing Portion of the Country Is Getting Back to Normal
Depending on where you live, inventory growth is going to vary. Some places are bouncing back faster than others. According to Lance Lambert, Co-Founder of ResiClub, in January 2025, just a little over one year ago, only 41 of the 200 largest metros were back to normal inventory-wise.
But around the end of year, almost half (90) of the largest 200 metro areas were back at or above typical levels. That’s a big improvement in roughly a year. And it’s not done yet.
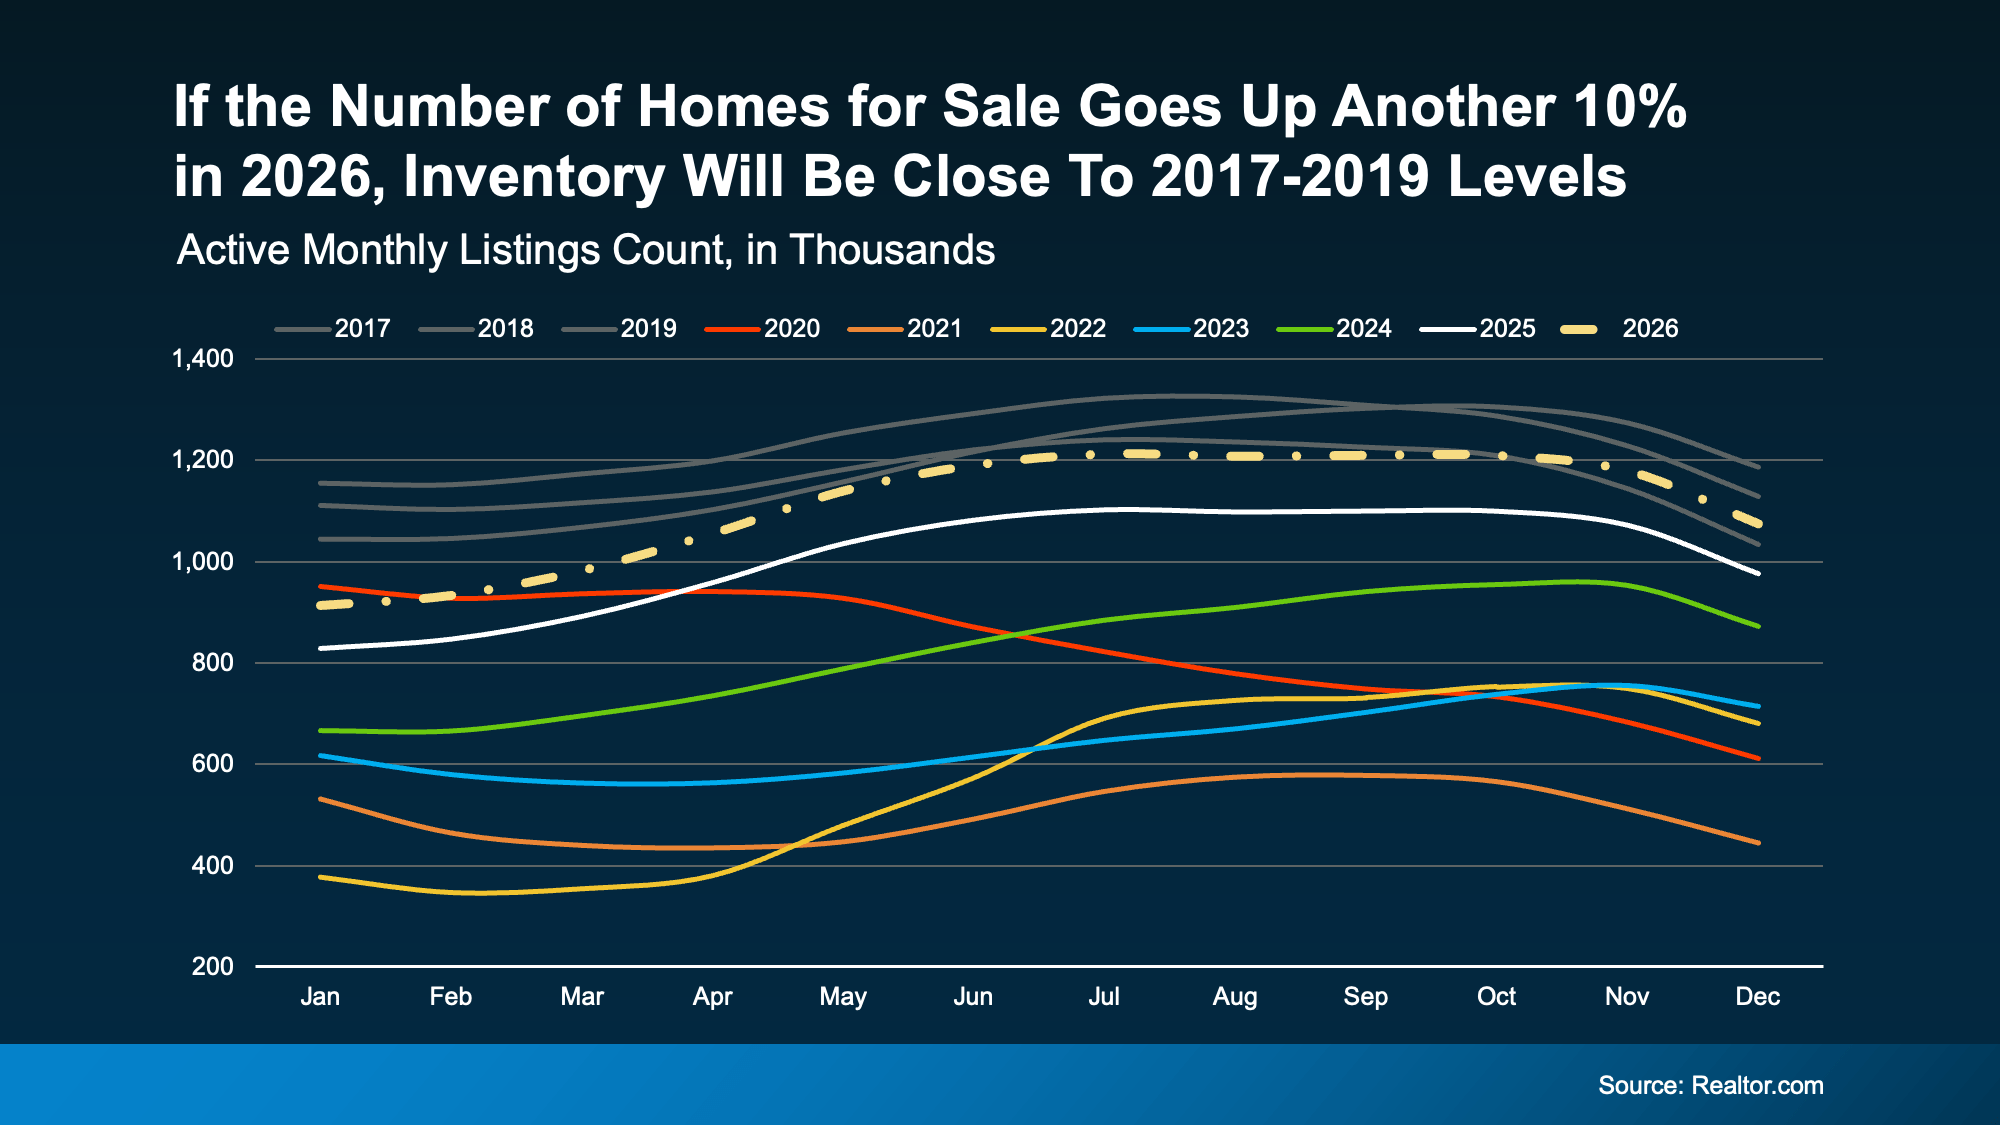
Inventory Is Expected To Keep Growing
Looking ahead, forecasts suggest the number of homes for sale could rise another 10% this year, which means even more markets should join the list of places where supply has rebounded.
Here’s a graph that shows what an extra 10% would do for the market this year. You can see that projected growth (shown in the dotted line) hits inventory levels seen in 2017-2019 by roughly this fall (the gray lines). That means we may reach normal by end of year, nationally:
And that changes your home search in a good way. As Hannah Jones, Senior Economic Research Analyst at Realtor.com, puts it:
“. . . housing market conditions are gradually rebalancing after several years of extreme seller advantage. Buyers are beginning to see more options and modest negotiating power as inventory improves . . .”
In other words, the market is starting to work with buyers again — not against them.
Bottom Line
Inventory isn’t fully back to normal everywhere. But it’s moving in the right direction. And, in some areas, it’s already there.
If you’ve been waiting for a moment when you have options and a little breathing room, this is the strongest setup buyers have seen in a long time.
If you want to know what’s happening in our local market, let’s talk.
All •
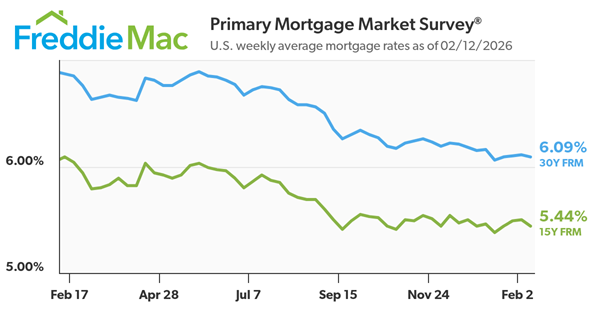
February 12, 2026
Mortgage Rates Continue to Inch Down

Freddie Mac (OTCQB: FMCC) today released the results of its Primary Mortgage Market Survey® (PMMS®), showing the 30-year fixed-rate mortgage (FRM) averaged 6.09%.
“Bolstered by strong economic growth, a solid labor market and mortgage rates at three-year lows, housing affordability continues to measurably improve. These factors have caught the attention of many prospective homebuyers, driving purchase application activity higher than a year ago,” said Sam Khater, Freddie Mac’s Chief Economist.

- The 30-year FRM averaged 6.09% as of February 12, 2026, down from last week when it averaged 6.11%. A year ago at this time, the 30-year FRM averaged 6.87%.
- The 15-year FRM averaged 5.44%, down from last week when it averaged 5.50%. A year ago at this time, the 15-year FRM averaged 6.09%.
The PMMS® is focused on conventional, conforming, fully amortizing home purchase loans for borrowers who put 20% down and have excellent credit.


