

 Facebook
 X
X
 Pinterest
 Copy Link
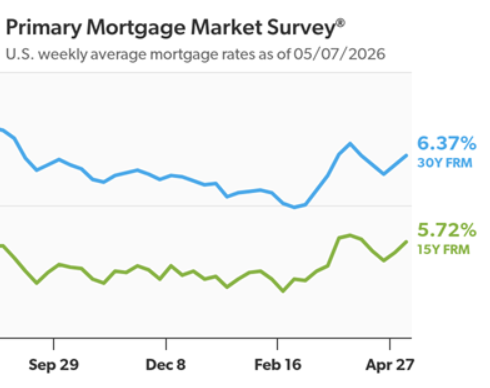
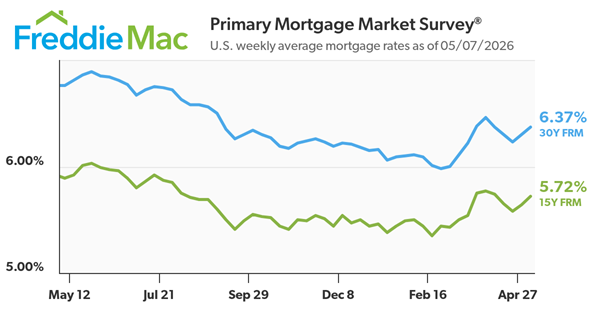
Freddie Mac (OTCQB: FMCC) today released the results of its Primary Mortgage Market Survey® (PMMS®), showing the 30-year fixed-rate mortgage (FRM) averaged 6.37%.
“The 30-year fixed-rate mortgage averaged 6.37% this week,” said Sam Khater, Freddie Mac’s Chief Economist. “Recent data points to slightly better conditions for buyers with a boost in new-home sales, median new-home prices being down to their lowest level since July 2021, and higher inventory than in recent years. Together, these trends could modestly ease affordability pressures through the spring homebuying season.”
- The 30-year FRM averaged 6.37% as of May 7, 2026, up from last week when it averaged 6.30%. A year ago at this time, the 30-year FRM averaged 6.76%.
- The 15-year FRM averaged 5.72%, up from last week when it averaged 5.64%. A year ago at this time, the 15-year FRM averaged 5.89%.
The PMMS® is focused on conventional, conforming, fully amortizing home purchase loans for borrowers who put 20% down and have excellent credit.
30-Year Mortgage Averages 6.37% This Week
Rates Tick Up But Still Below Last Year’s Level
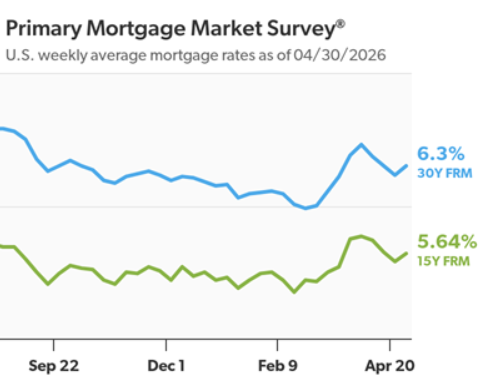
Freddie Mac today released the results of its Primary Mortgage Market Survey® (PMMS®), showing the 30-year fixed-rate mortgage (FRM) averaged 6.30%.
“The 30-year fixed-rate mortgage averaged 6.30% this week,” said Sam Khater, Freddie Mac’s Chief Economist. “As rates had modestly declined the last few weeks, purchase demand has accelerated with purchase applications rising to over 20 percent above a year ago. It is clear that purchase demand continues to hold up as prospective buyers react to both modestly lower rates and more inventory to choose from than the last few years.”
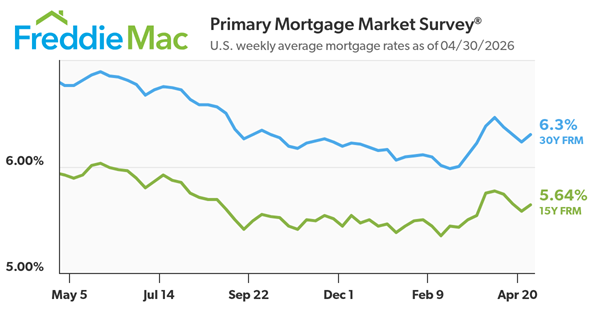
- The 30-year FRM averaged 6.30% as of April 30, 2026, up from last week when it averaged 6.23%. A year ago at this time, the 30-year FRM averaged 6.76%.
- The 15-year FRM averaged 5.64%, up from last week when it averaged 5.58%. A year ago at this time, the 15-year FRM averaged 5.92%.
The PMMS® is focused on conventional, conforming, fully amortizing home purchase loans for borrowers who put 20% down and have excellent credit.
Videos •
April 28, 2026
When Do I Lock-In My Mortgage Rate?

Lately, mortgage rates have been a bit volatile. And that may have made you second guess your move. But here’s something to put it all into perspective. Even now, rates are the lowest they’ve been in the last 3 Spring seasons. So, if you want to buy, this could still be a good time to make it happen. Let’s chat.
All •
April 23, 2026
Another Decline in Weekly Average
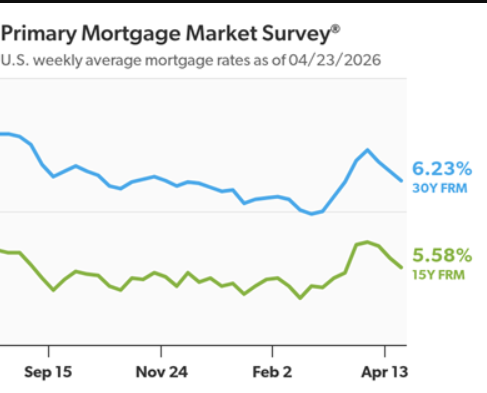
Freddie Mac today released the results of its Primary Mortgage Market Survey® (PMMS®), showing the 30-year fixed-rate mortgage (FRM) averaged 6.23%.
“The 30-year fixed-rate mortgage declined again this week to 6.23%,” said Sam Khater, Freddie Mac’s Chief Economist. “Rates currently stand at their lowest level in the last three spring homebuying seasons. This improvement, coupled with a pickup in purchase applications and refinance activity, as well as an increase in monthly pending home sales, underscores signs of improving momentum in the market.”
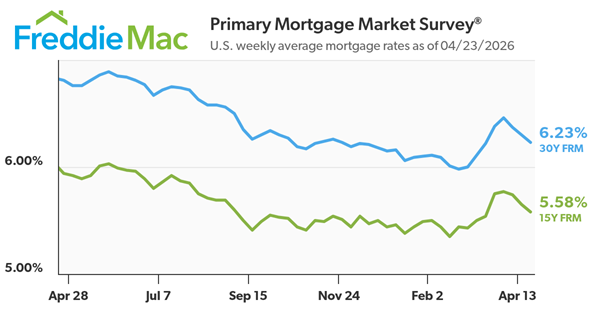
- The 30-year FRM averaged 6.23% as of April 23, 2026, down from last week when it averaged 6.30%. A year ago at this time, the 30-year FRM averaged 6.81%.
- The 15-year FRM averaged 5.58%, down from last week when it averaged 5.65%. A year ago at this time, the 15-year FRM averaged 5.94%.
The PMMS® is focused on conventional, conforming, fully amortizing home purchase loans for borrowers who put 20% down and have excellent credit.

Wondering If You Should Still Buy a Home Right Now? Here’s What To Keep in Mind.

With economic headlines, global events, and near constant talk about affordability, you may be wondering if this is the right time to move. But here’s what you need to remember.
While recent events do have some impact on the housing market, they don’t take buying off the table. You just have to use a different strategy.
Mortgage Rates Have Been Up Slightly – Here’s Why
After trending down for most of 2025, mortgage rates have been higher again for over roughly a month now. And experts say it’s a result of what’s happening overseas and in the broader economy. As Mark Fleming, Chief Economist at First American, explains:
“Mortgage rates have recently moved higher, driven by geopolitical uncertainty and rising energy costs that are contributing to inflation concerns.”
But what does that really mean for you? Should you wait for everything to settle back down before you buy a home?
The short answer is no. You don’t have to wait.
Your Window To Buy Didn’t Close
It’s true that a month or so ago, when rates were just shy of 6%, buying felt a bit more affordable. And now that rates are hovering around the mid-6s, monthly payment costs are higher.
But zoom out for a second.
Let’s say you’re taking out a loan for $500k. Even with rates in the mid 6s, you’re still saving roughly $300 on your monthly payment compared to buyers who made their purchase early last year.
That means this recent increase in rates hasn’t erased the progress we’ve seen. Buying is still more affordable than it was just one year ago (see below):
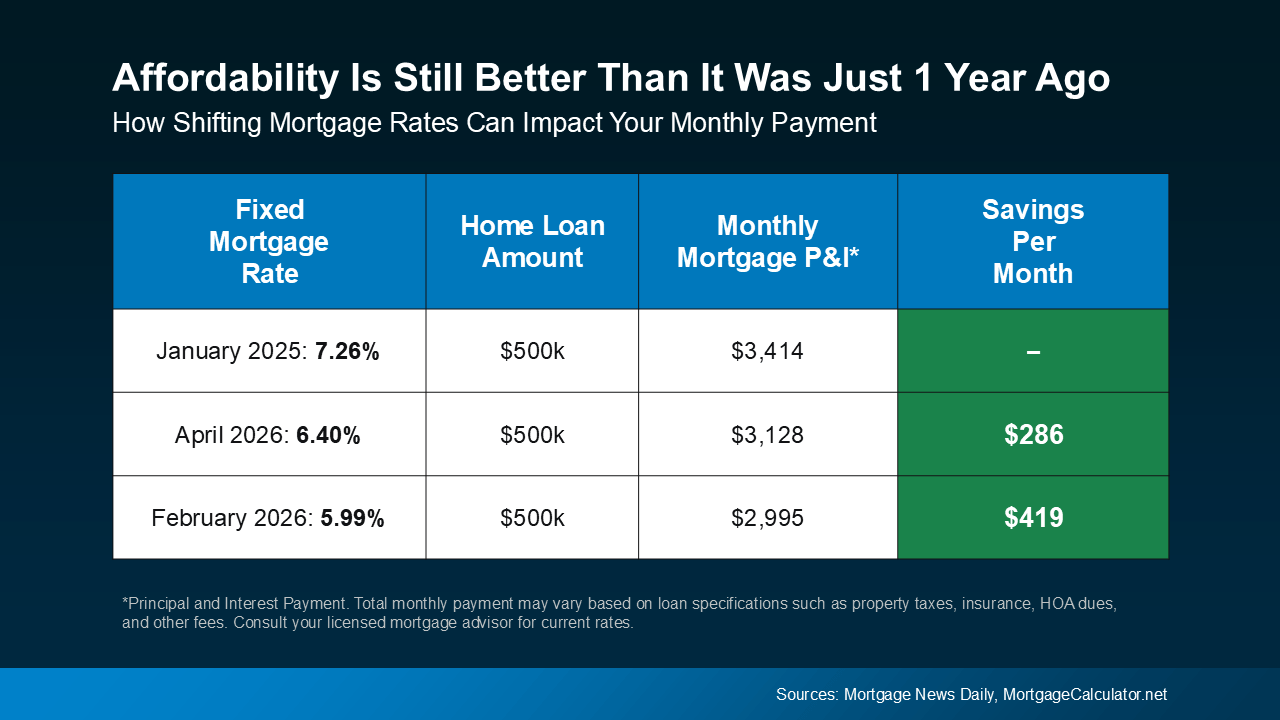 Sure, your monthly payment would’ve been a little less expensive a few weeks back. But hindsight is always 20/20.
The goal moving forward shouldn’t be to perfectly time the market. Things change too quickly for that. Instead, the real goal is to make the best decision you can based on where things are today. And the best advice anyone can give is: brace for volatility.
When It Comes To Rates, Expect the Unexpected
Mortgage rates are going to continue to be move around in the weeks or months ahead as new information and economic reports come out.
Try to remember, you can’t control global events or where rates go next week (or even next month). But you can control how you prepare. If you do that, it becomes less about the headlines, and more about your situation.
If You Want or Need To Move, You Still Can
The simple truth is, if you want or need to move, you still can.
Some buyers are choosing to move forward right now because their needs haven’t changed. A growing family, a job relocation, a lifestyle shift – those things still matter.
And for buyers who do decide to move forward, there are ways to make it work.
For example, you could explore options like adjustable-rate mortgages (ARMs) to get a lower rate upfront. That may or may not be the right fit for you, but it highlights an important point: there are strategies that can help you move, even now.
What matters most is having a plan.
And working with the right agent and lender is a big part of that. With expert help, you’ll:
- Understand your budget and what the math looks like at today’s rates.
- Explore your financing options, including ARMs and assistance programs.
- Have trusted guidance from experts who’ll keep you up to date throughout the process.
Bottom Line
Even though there’s some uncertainty, that doesn’t mean you’re out of options.
If you need to move, you still can. Let’s connect so we can explore all your options and make your move happen.
A Tick Down In Mortgage Rates.
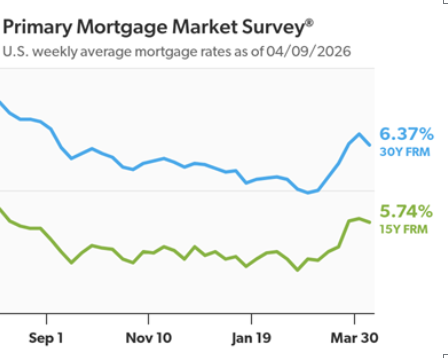
Freddie Mac today released the results of its Primary Mortgage Market Survey® (PMMS®), showing the 30-year fixed-rate mortgage (FRM) averaged 6.37%.
“Mortgage rates ticked down this week, averaging 6.37%,” said Sam Khater, Freddie Mac’s Chief Economist. “The decrease in rates represents a positive development for prospective homebuyers and could spark a more favorable spring homebuying season than last year.”
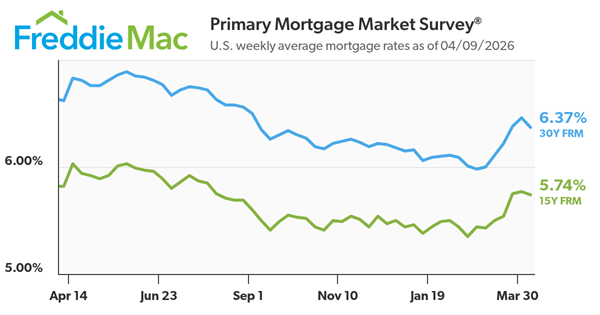
- The 30-year FRM averaged 6.37% as of April 9, 2026, down from last week when it averaged 6.46%. A year ago at this time, the 30-year FRM averaged 6.62%.
- The 15-year FRM averaged 5.74%, down from last week when it averaged 5.77%. A year ago at this time, the 15-year FRM averaged 5.82%.
The PMMS® is focused on conventional, conforming, fully amortizing home purchase loans for borrowers who put 20% down and have excellent credit.
All •
April 8, 2026
Thinking About an Adjustable-Rate Mortgage?

If you’ve been looking for a home lately, you’ve probably felt how tough affordability still is. And that’s exactly why more buyers are opting for adjustable-rate mortgages, or ARMs.
Here’s what you need to understand about how they work, and whether they make sense for you.
What Is an Adjustable-Rate Mortgage?
Since a lot of people aren’t familiar with this type of loan, let’s start with a definition. This is how Business Insider explains the main difference between a fixed-rate mortgage and an adjustable-rate mortgage:
“With a fixed-rate mortgage, your interest rate remains the same for the entire time you have the loan. This keeps your monthly payment the same for years . . . adjustable-rate mortgages work differently. You’ll start off with the same rate for a few years, but after that, your rate can change periodically. This means that if average rates have gone up, your mortgage payment will increase. If they’ve gone down, your payment will decrease.”
Basically, one doesn’t change much over the life of your loan.
And one could change… either by a little, or a lot.
Of course, things like taxes or homeowner’s insurance can still have an impact on a fixed-rate loan, but the baseline of your mortgage payment is fairly steady. But the big difference is that with an ARM, your monthly payment could change over time.
Why Adjustable-Rate Mortgages Are Getting More Attention
So, why do some buyers choose this option? It’s simple. It’s because of the upfront savings. Business Insider explains it like this:
“Because ARM rates are typically lower than fixed mortgage rates, they can help buyers find affordability when rates are high. With a lower ARM rate, you can get a smaller monthly payment or afford more house than you could with a fixed-rate loan.”
And right now, according to Mortgage News Daily and the Wall Street Journal, the upfront rate on an ARM is lower than a 30-year fixed mortgage (see graph below):
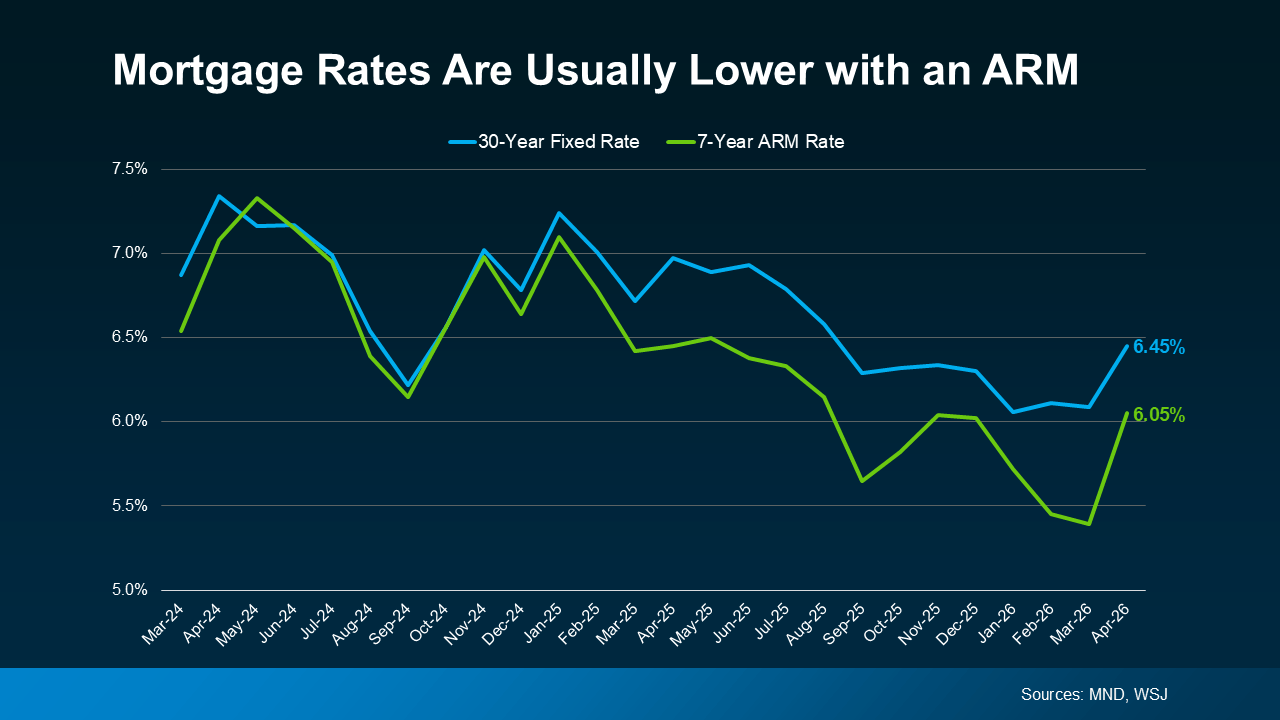 If you’re wondering how that shakes out in real dollars and cents, here’s what Redfin says. According to their research, the typical buyer could save about $150 per month by taking out an ARM instead of a 30-year fixed mortgage.
For some people, that’s enough to make a difference.
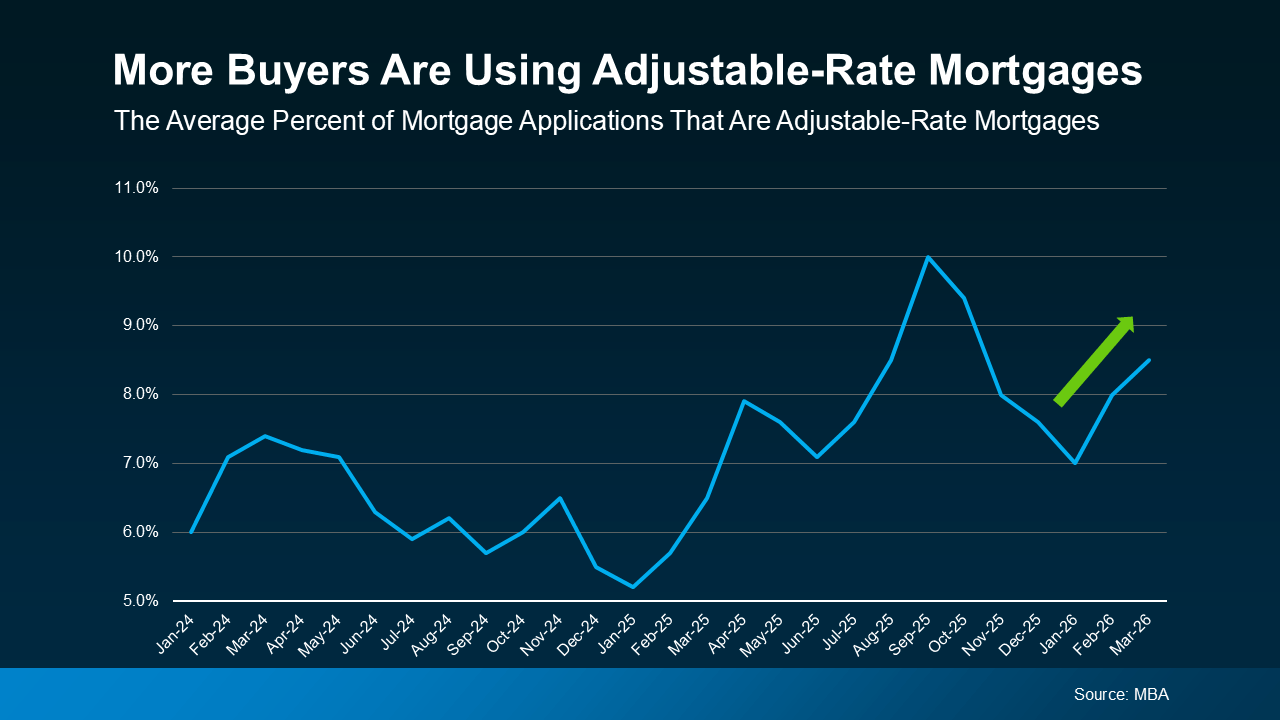
More Buyers Are Choosing Adjustable-Rate Mortgages Today
A growing number of buyers are willing to trade the uncertainty later for a lower payment now. Data from the Mortgage Bankers Association (MBA) shows the share of buyers choosing ARMs has increased, especially over the last few years (see graph below).
This doesn’t mean ARMs are becoming the go-to option for everyone. It only means some buyers are opting for this type of mortgage, so they can still buy today.
 And if you remember the housing crash, seeing ARMs gain popularity again may raise concerns. But rest easy. Today’s ARMs aren’t the same.
Back then, some buyers were given loans they couldn’t afford once rates adjusted.
Today, lending standards are stricter, and lenders evaluate whether borrowers could still handle the payment if rates rise. So, the return of ARMs doesn’t signal another widespread crash. It just reflects how some buyers are adapting to today’s affordability challenges.
The Trade-Off – What You Need To Consider
If you’re considering an adjustable-rate mortgage yourself, just remember it really all depends on your situation and your risk tolerance.
An ARM may make sense if you plan to move before your rate would adjust or if you expect you’ll make a higher income in the future. But there are trade-offs you need to think through.
For example, once the fixed period ends, your rate can adjust, and your payment could increase, potentially by a meaningful amount depending on where rates are at that time.
And keep in mind, there’s also no guarantee mortgage rates will come down in the future, which means refinancing later isn’t always an option. That’s why it’s important to think through your plan, understand your long-term earning potential, and work closely with a trusted lender before you choose an ARM.
Bottom Line
ARMs are getting more attention again because they can make buying a home more affordable in the short term. But they’re not right for everyone.
The key is understanding how they work, what the risks are, and whether they fit your plan. And that’s why you need to talk to a trusted lender and financial advisor before you make any decisions.
Selling •
April 7, 2026
Your House Hasn’t Sold Yet. Should You Rent It Out Instead?
When your house sits on the market longer than expected, it can get frustrating fast.
You start asking: what now? And for a growing number of homeowners, that turns into: should I just rent it instead?
While it sounds like a simple backup plan, becoming “accidental landlord” is actually a much bigger decision than most people realize. That’s when someone planned to sell, didn’t get the price or traction they hoped for, and decided to rent the house out instead.
And lately, that’s happening more often.
Why the Number of Accidental Landlords Is Rising
If you’re faced with the same choice to rent or to sell, here’s what you need to know. First, you’re not alone. And that should actually be some comfort.
According to Zillow about 2.3% of homes available for rent were previously listed for sale. That may not sound like a lot, but it’s actually the highest share in almost 6 years.
Before you go that route yourself, it’s worth slowing down and looking at the full picture. Ask yourself these 3 questions first.
1. Would Your House Actually Work as a Rental?
What’s right for your situation is going to depend on your location, your home’s condition, and what the rental market looks like in your area. Think about:
- If you’re moving away, do you have a plan for how you’ll handle ongoing maintenance and repairs from afar?
- Does your house need repairs before it’s rental-ready? And do you have the time, energy, and the funds for that?
- What’s the market like in your area? Are there a lot of rental vacancies?
- What monthly rent could you realistically expect?
As C&C Property Management explains:
“At the heart of any rental market is the balance between supply and demand. When more tenants are looking for housing than there are available units, rental prices rise. On the other hand, if new construction adds hundreds of apartments or homes to a neighborhood, prices can soften as tenants have more choices.”
If your home would struggle to stand out or command the rent you need, that’s something to take seriously. Just because you can rent it doesn’t mean it’s the best option for you.
2. Are You Ready To Be a Landlord?
This is the part people don’t always think about upfront. On paper, renting sounds like easy passive income. But in reality, it’s a hands-on responsibility. Imagine:
- Taking midnight calls about clogged toilets or broken air conditioners
- Chasing down missed rent payments
- Covering unexpected repairs
- Fixing damage between tenants
And those costs can hit when you least expect them.
3. Have You Run the Real Numbers?
There’s also the financial side of things. For starters, renting out your house comes with extra expenses. Here are a few of the biggest according to Bankrate:
- Higher insurance premiums (landlord insurance typically costs about 25% more)
- Management fees (if you use a property manager, they typically charge around 10% of the rent)
- Routine maintenance and services
- Advertising fees to find tenants
- Gaps between tenants, where you cover the mortgage without rental income coming in
For some people, that’s totally manageable. For others, it’s more than they want to take on.
Your Next Step: A Conversation with Your Agent
Before you make any decision, talk to your current agent about overhauling your sales strategy first. Sometimes it’s not that buyers aren’t out there. It’s that something about the pricing, presentation, or marketing isn’t quite lining up with what they’re looking for.
And a few small adjustments can make a big difference.
Because while renting can be a great choice for the right person with the right house, if you’re only considering it because your listing didn’t get traction, there may be a better solution.
Bottom Line
If you’re torn between selling and renting, make sure to carefully weigh the pros and cons first. For some homeowners, the hassle (and the expense) of renting may not be worth it.


