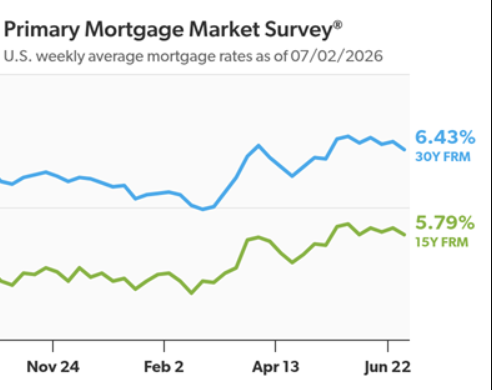
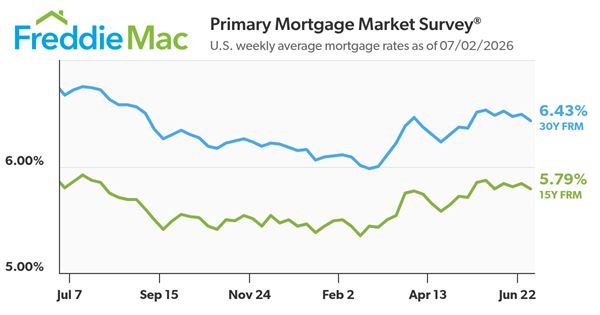
“The 30-year fixed-rate mortgage eased slightly this week averaging 6.43%” said Sam Khater, Freddie Mac’s Chief Economist. “With rates at a seven-week low and purchase demand continuing to edge higher, it’s an encouraging sign as prospective homebuyers respond to modest improvements in affordability.”
The 30-year FRM averaged 6.43% as of July 2, 2026, down from last week when it averaged 6.49%. A year ago at this time, the 30-year FRM averaged 6.67%.
The 15-year FRM averaged 5.79%, down from last week when it averaged 5.84%. A year ago at this time, the 15-year FRM averaged 5.80%.
The PMMS® is focused on conventional, conforming, fully amortizing home purchase loans for borrowers who put 20% down and have excellent credit.
When your house doesn’t sell, it’s not just disappointing. It messes with your timing. Your plans. Your confidence. You start second-guessing everything, including the decision to move in the first place. And that raises 2 big questions:
Do you try again?
Is that even worth it?
Here’s the secret to getting a better outcome the second time around.
Different Agent. Different Results.
Most sellers who re-list and ultimately sell don’t wait for market to magically change. They change their approach. And there’s data to back that up.
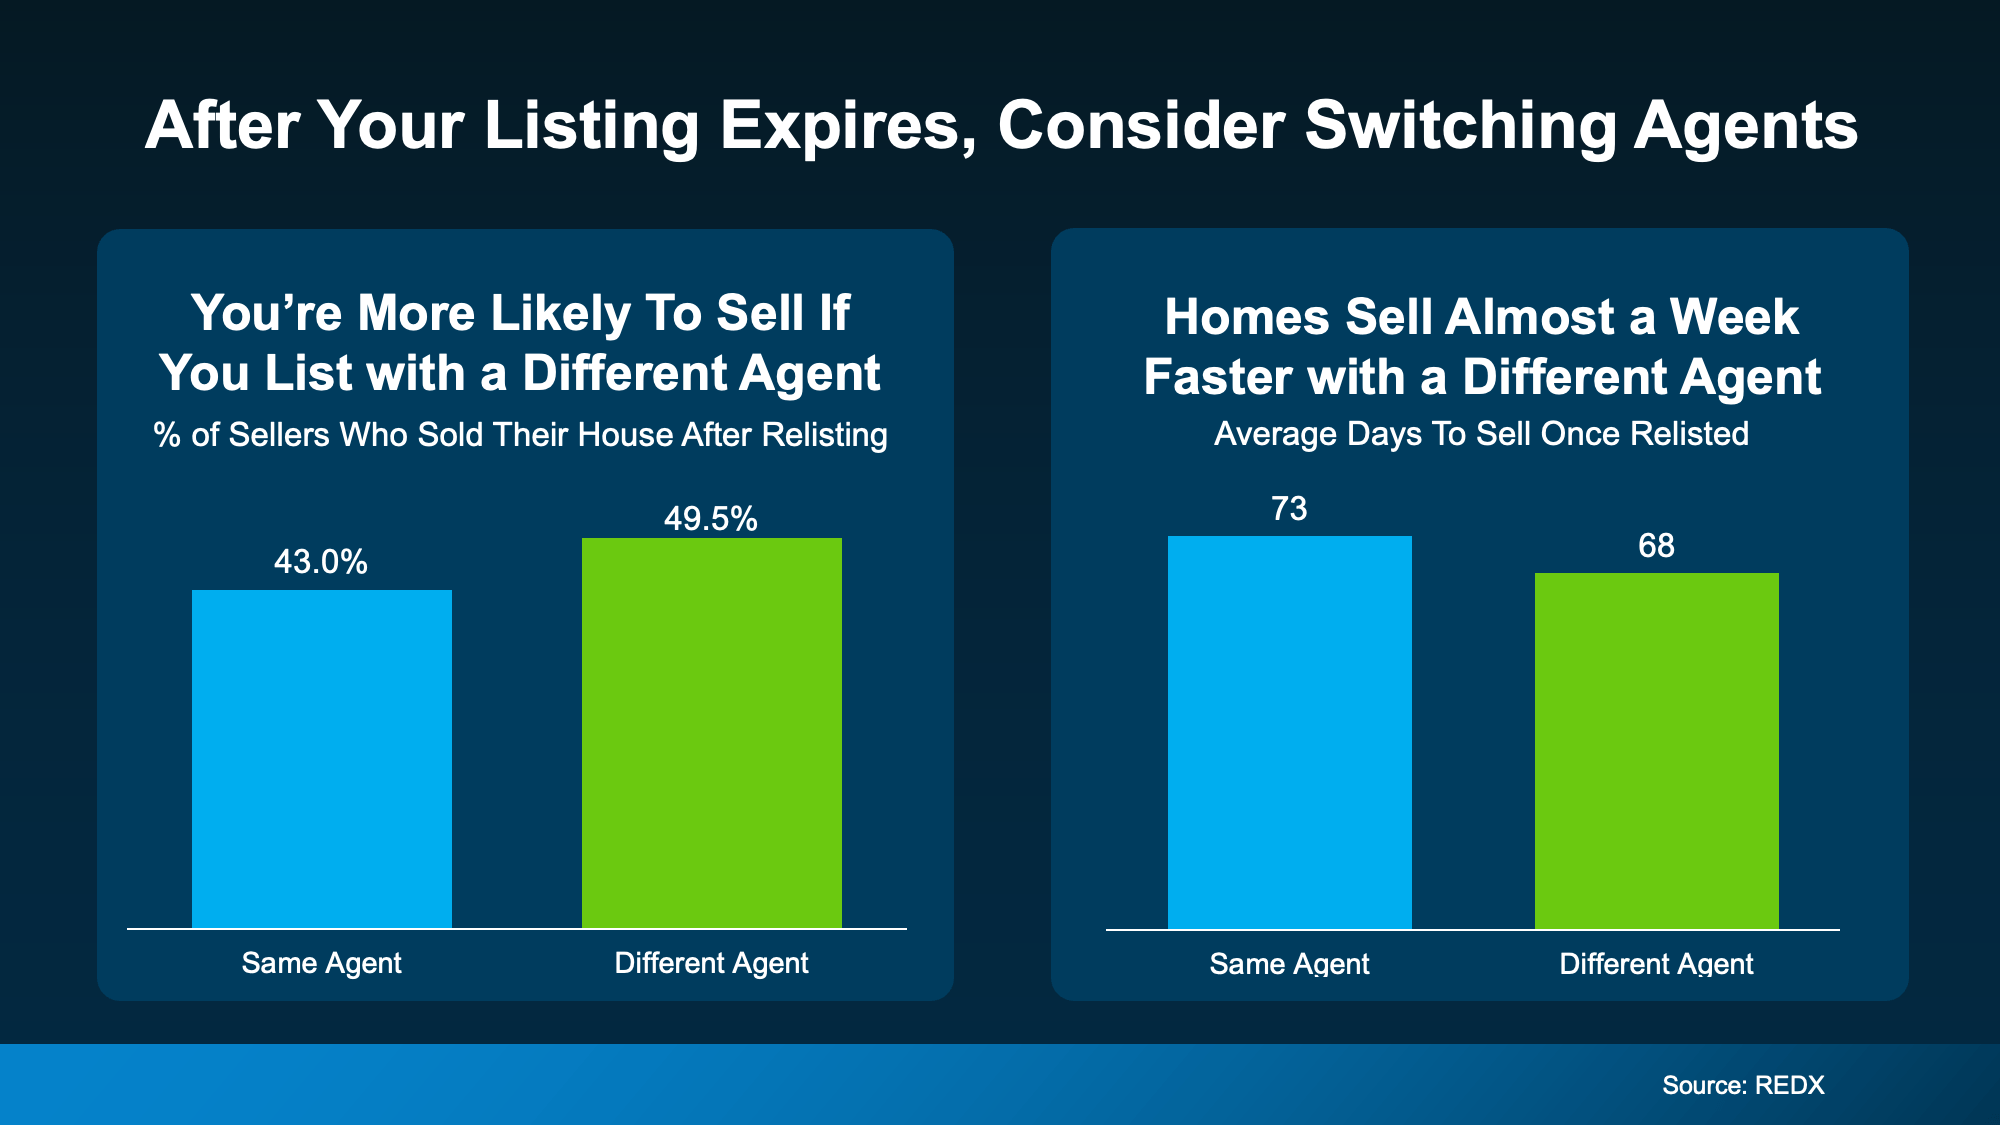
Research from REDX shows homeowners who put their house back on the market with a different agent are more likely to sell than homeowners who re-used the same agent. Not to mention, they see their homes sell faster (see graph below):
That’s the power of a fresh set of eyes. Because in a moment like this, the worst thing you can do is rerun the same set of plays and expect a different outcome. A different agent can bring a new perspective on where things went off track – and a lot of the time, one of these things happened.
1. The Asking Price Didn’t Match Buyer Reality
There’s a saying that’s especially important in today’s market, and it’s: “if your price isn’t compelling, it’s not selling.” Maybe that’s what happened with your house.
With mortgage rates where they are and inflation driving up the cost of everyday purchases, buyers have less room to stretch. If they feel like your house is priced even a little high, it’s going to get skipped over. And if no one looks at it, it’s not going to sell.
The Fix: Price to draw buyers in, not push them away. Have an agent pull fresh data from recent sales so your asking price matches what buyers are actually paying right now.
2. The First Impression Didn’t Win the Click
Most buyers decide whether they want to tour a home in seconds. If the photos look dark, or dated, they scroll right past. And while you may think: “If they just saw it in person, they’d get it,” you may not get that chance.
And honestly, even in person, small things can quietly kill momentum – worn down paint, outdated fixtures, clutter, or a yard that feels high-maintenance. Individually, they’re small. Stacked together, they create doubt.
The Fix: Walk the house like you’re a buyer, not the owner. Start with what’s easy and obvious – paint, lighting, curb appeal, decluttering. Then update the photos so they match the best version of your house.
3. The Marketing Was Too “Set It and Forget It”
Today, the number of homes for sale has grown in many areas. Buyers have more options, which means your house needs a plan to stand out. A generic description and a basic upload to the MLS can blend in fast.
The Fix: Find an agent who can build stronger exposure through digital marketing and social platforms, plus content that makes buyers stop – strong photos, a smart description, a video walk-through, and a plan for open houses and follow-up.
4. There Was No Clear Plan for Feedback
Sometimes the house gets showings, but no offers. If that was your experience, it actually tells you something important. Buyers liked it enough online to come see it. So, something else was holding them back.
Those buyers were sending a message. It just wasn’t translated into action.
The Fix: Make sure your agent has a clear plan for seeking out and acting on feedback quickly. That dialogue often points to the one change that would get a house sold.
5. The Deal Couldn’t Get Over the Finish Line
Even when a house is priced well and marketed right, deals fall apart when there’s no plan for the human side of the transaction.
Buyers today are more likely to ask for repairs, credits, or help with closing costs than a few years ago. In this type of market, being unwilling to negotiate can cost you more than a reasonable concession ever would.
The Fix: Decide ahead of time what matters most to you and where you can be flexible. Keep the dialogue open and lean on your agent for advice.
Bottom Line
If your house didn’t sell the first time, you’re not stuck. You just need a different strategy, and maybe a different partner.
When you’re ready for a fresh set of eyes on what happened and what to change first, let’s connect.
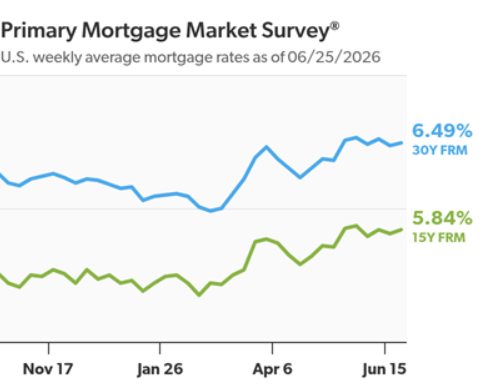
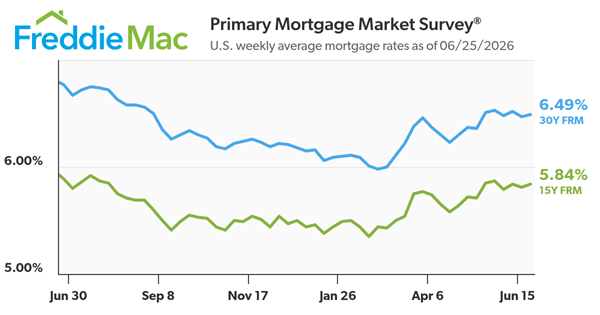
“The average 30-year fixed mortgage rate was little changed this week at 6.49%” said Sam Khater, Freddie Mac’s Chief Economist. “Rates have remained relatively stable over the last six weeks. Meanwhile, purchase activity eased modestly and refinance activity has continued to pick up recently, reflecting borrowers’ responsiveness to current rate levels.”
The 30-year FRM averaged 6.49% as of June 25, 2026, up from last week when it averaged 6.47%. A year ago at this time, the 30-year FRM averaged 6.77%.
The 15-year FRM averaged 5.84%, up from last week when it averaged 5.81%. A year ago at this time, the 15-year FRM averaged 5.89%.
The PMMS® is focused on conventional, conforming, fully amortizing home purchase loans for borrowers who put 20% down and have excellent credit.
Open up a home search and you’ll see them. Listings that have been on the market for two months. Three. Some longer.
Most buyers scroll right past them, assuming something’s wrong with the house. But that instinct could be costing you, since the longer a home sits, the more motivated the seller usually gets.
Where Some Buyers Are Finding Better Deals
If affordability has been your #1 hurdle to buying, here’s a surprisingly simple strategy that could help you finally get your foot in the door. Start with the homes that have been sitting the longest. That’s often where the best deals are.
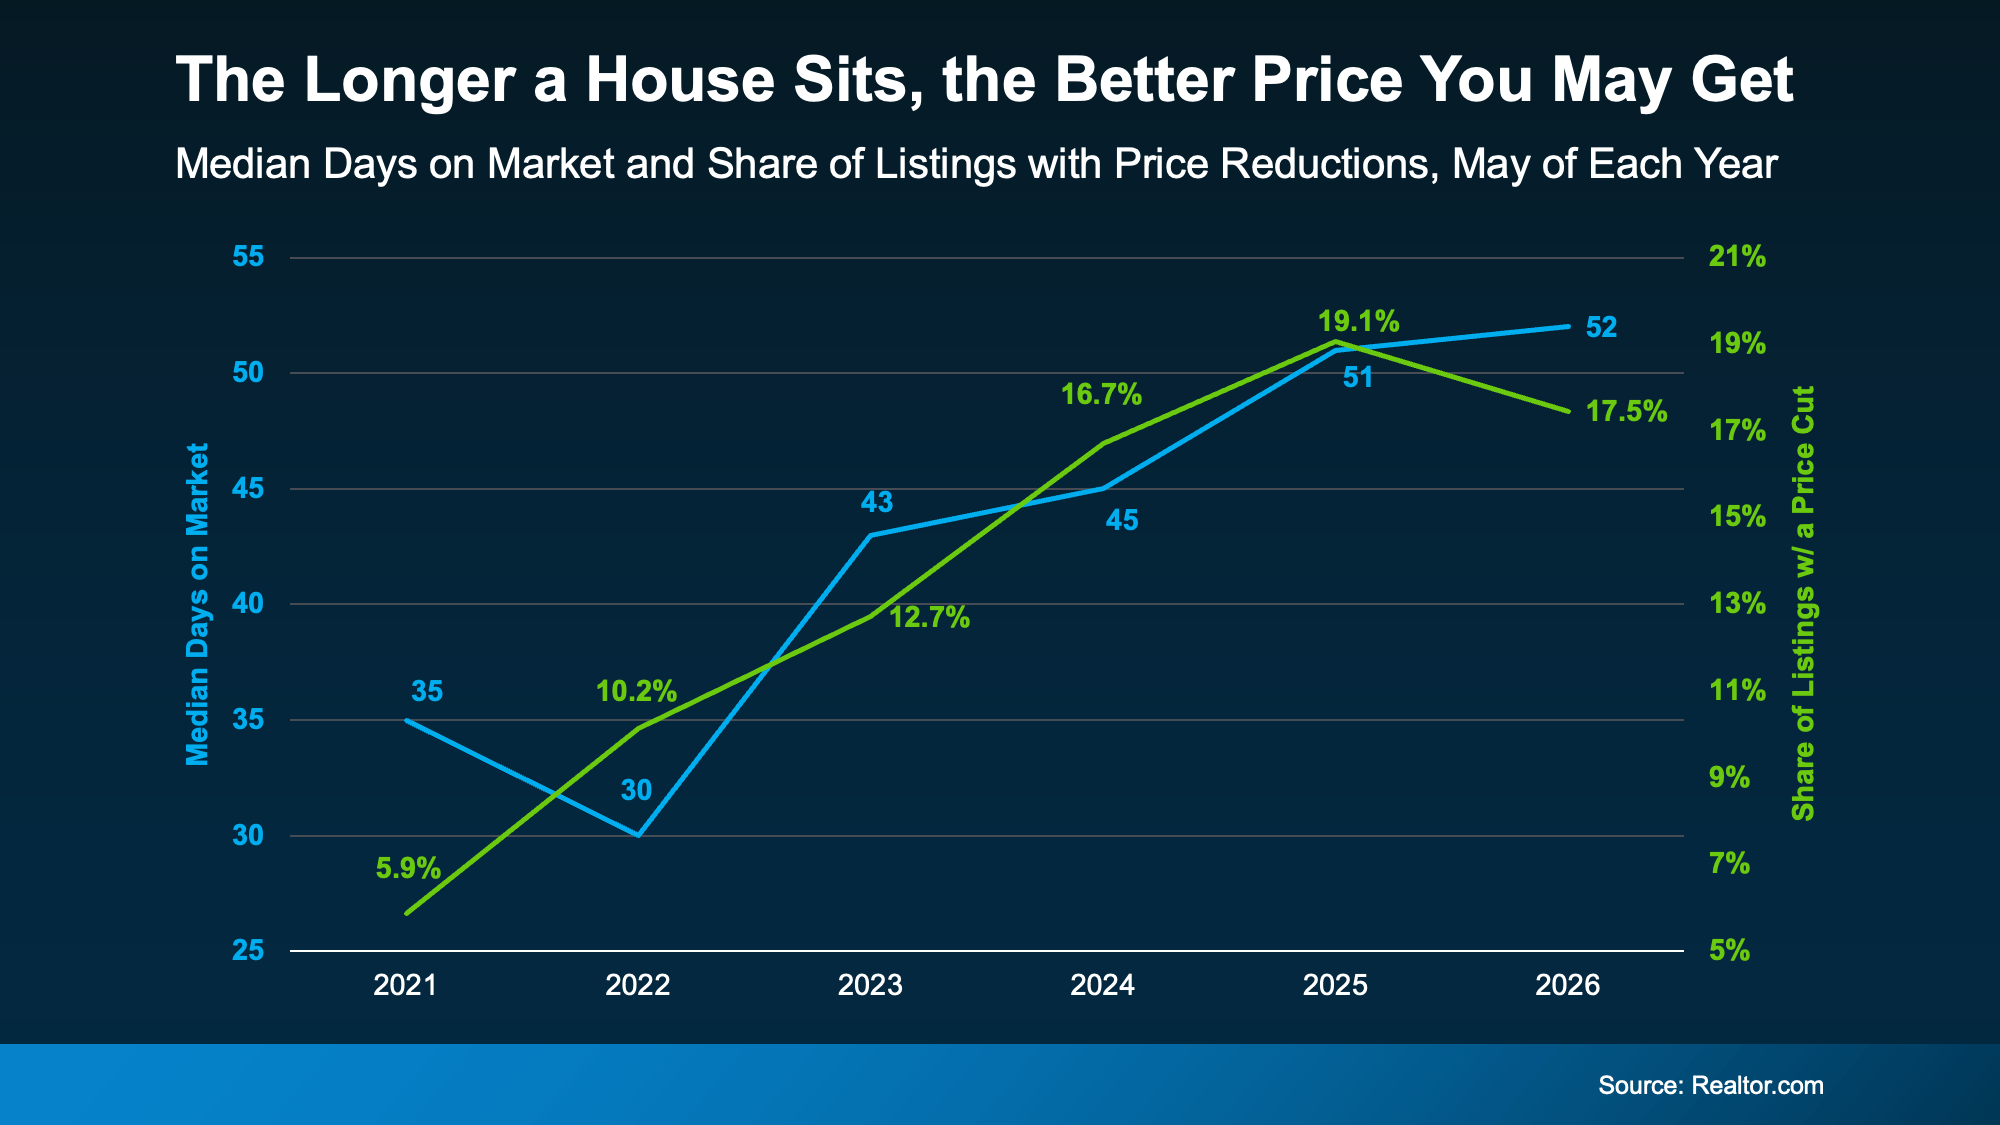
Here’s why. Data from Realtor.com shows there’s a connection between longer time on the market and lower sales prices. Basically, the longer a house sits, the more likely it is that the seller will reduce the price (see graph below):
The blue line tracks how long homes stay on the market, while the green line tracks the share of homes getting a price reduction. As one climbs, so does the other.
And if you focus on these homes that are just sitting and waiting, the opportunity for you is bigger than you may think right now.
Redfin data shows there’s $347 billion worth of stale listings on the market right now – more than ever before for this time of year. So, ask your agent to filter listings for you from oldest to newest. The home that fits your budget might already be there. Just further down the list than you thought.
Lingering Doesn’t Always Mean Something’s Wrong
Let’s say you do that and something catches your eye. Still, you might be questioning why the home has been sitting in the first place. Just remember, sometimes it has nothing to do with the home itself.
According to Redfin, common causes are:
The asking price was set too high to start
The home didn’t show well online
There are a lot of homes for sale in the area, so it just got buried
So, nothing that’s necessarily a dealbreaker, or even anything that’s wrong with the home itself. If there’s a real issue, a thorough inspection will surface it. And that’s information you can use to negotiate. Not a reason to assume it’s a house worth skipping over.
How To Turn a Lingering Listing into a Win
So how do you capitalize on a lingering listing? According to USA Today, you have two main levers to pull.
The first is price. Work with your agent to study what comparable homes recently sold for, then build an offer around that. Coming in below asking price is fair game when a home has been sitting.
The second is concessions. If a seller won’t budge much on price, they may still help in other ways, like covering some closing costs, repair credits, or even a mortgage rate buydown that lowers your monthly payment.
A local agent has the context to tell which homes are the real opportunities and which are skippable.
Bottom Line
A house sitting on the market isn’t always a glaring red flag. In today’s market, it may be your best opportunity yet.
For help deciding which lingering listings are actually worth a second look, let’s connect.
A few years ago, sellers could get away with saying “no” to just about everything.
No repairs.
No concessions.
No negotiation.
If buyers wanted the house, they pretty much had to take it on the seller’s terms. But now that inventory’s grown, negotiations are becoming a normal part of the process again.
That’s why one of the most important things sellers need to understand right now is this:
The goal isn’t to “win” every negotiation.
Sometimes, it’s worth meeting buyers where they are to get a deal done, fast. One example? Helping with a buyer’s closing costs.
Let’s break that down, so you know what to expect if it comes up in your sale.
What Are Buyer Closing Costs?
Closing costs are the extra expenses buyers pay on top of their down payment when they purchase a home. Freddie Mac gives some examples:
Loan origination fees
Appraisal and inspection costs
Title and attorney fees
Survey fees and more
Typically, buyer closing costs range from about 2% to 5% of the home’s purchase price. So, on the typical $400,000 home, that could mean anywhere from $8,000 to $20,000 out of pocket.
And in today’s affordability-challenged market, that upfront cash can be a major hurdle for some buyers – even if they can comfortably afford the monthly mortgage payment itself.
That’s why more people are asking sellers for help.
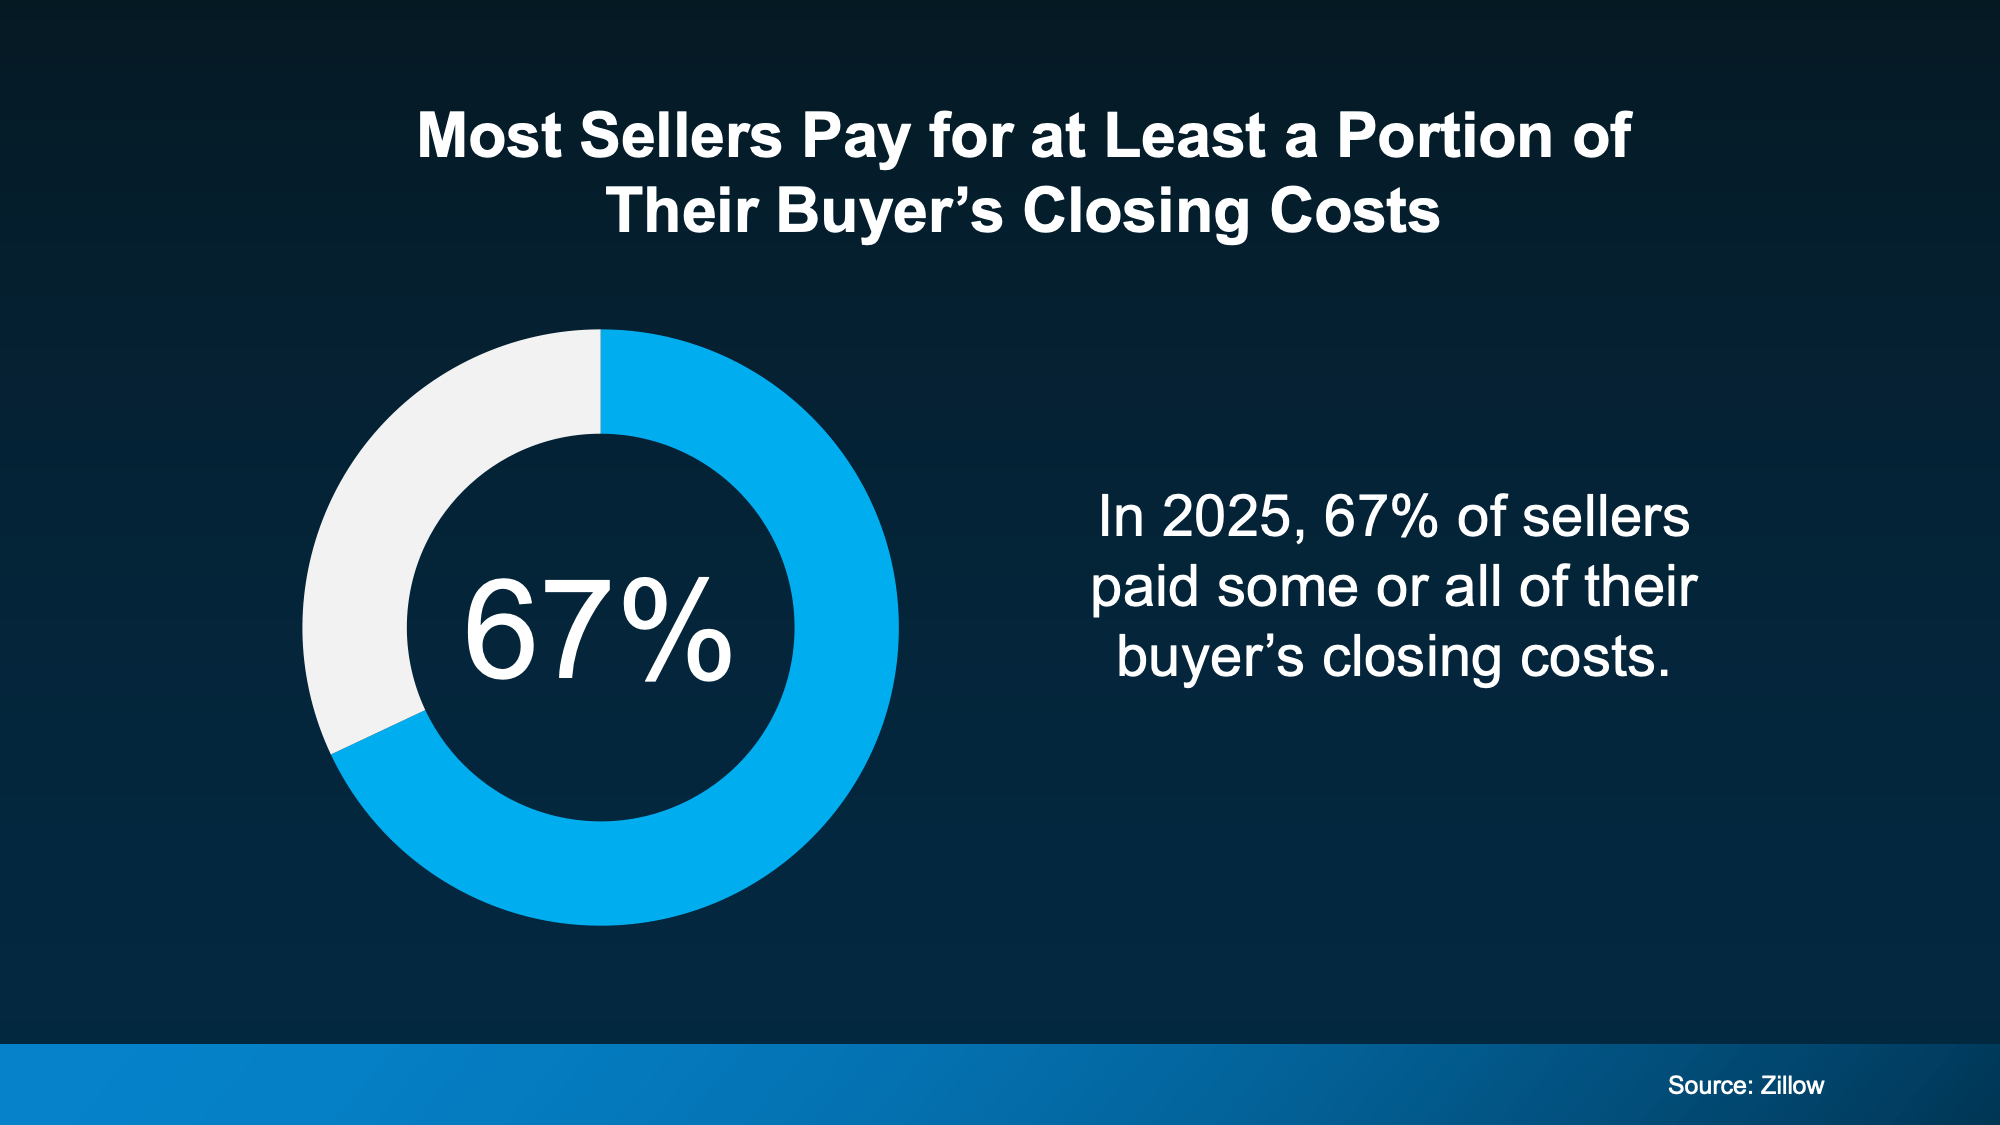
And More Sellers Are Saying “Yes”
According to the latest data from Zillow, 67% of sellers reported paying some or all of the buyer’s closing costs in 2025 (see chart below):
Now, that doesn’t mean every seller is doing it. And it definitely doesn’t mean every seller should. But it does show how common concessions have become as the market has shifted. And that’s important for you to know.
When Paying Closing Costs May Make Sense
This is where many sellers get stuck. They hear “help with closing costs” and immediately think: “Why should I pay for their expenses?”
But that’s not always the right way to look at it. You’ve got to consider who has the leverage in today’s market.
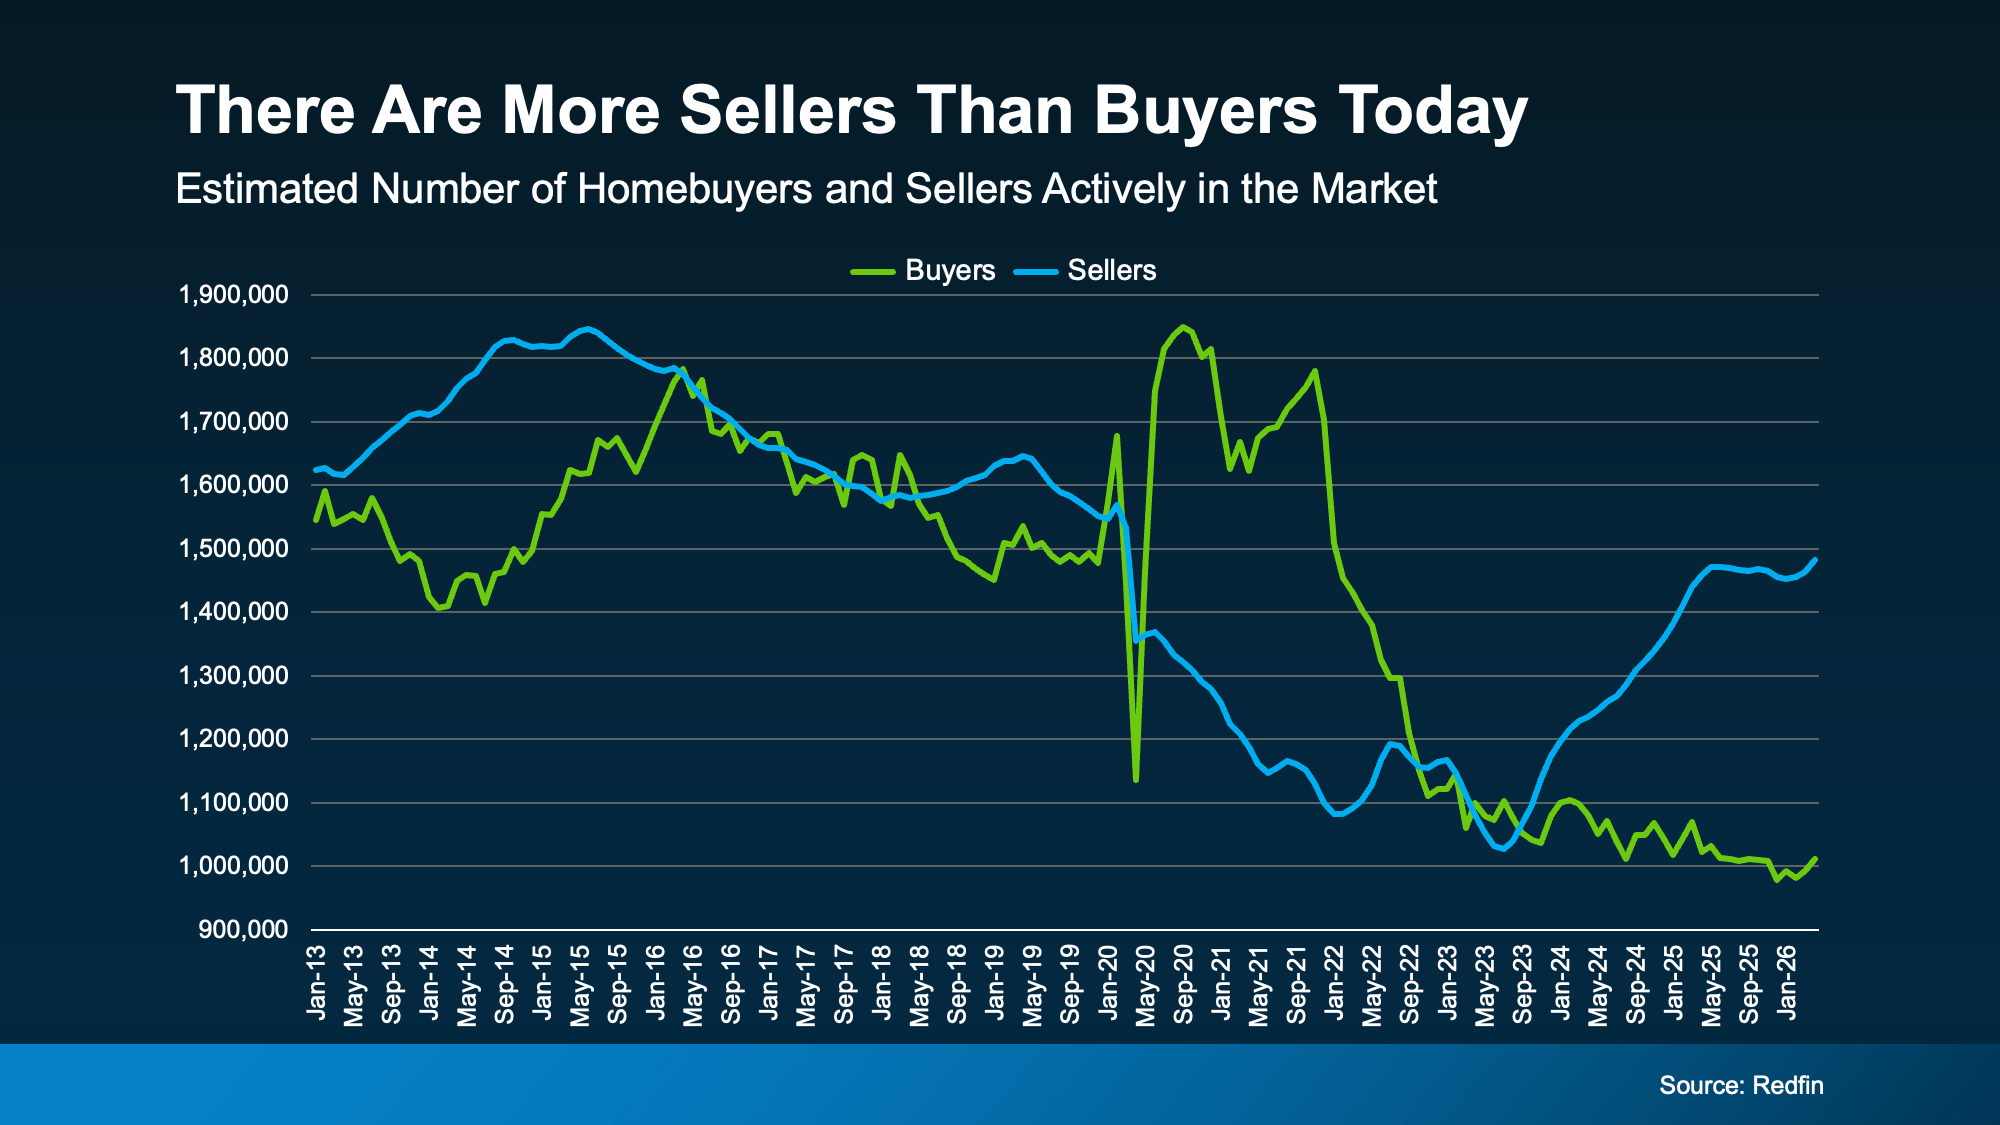
Redfin data shows there are more sellers than buyers active today. And that shifts the market dynamics (see graph below):
That doesn’t mean every market favors buyers. Far from it. In some areas, homes are still selling quickly and sellers have plenty of leverage. But in others, buyers have more room to negotiate than they’ve had in years.
That’s why local market conditions matter so much when you make your decision.
For example, helping with closing costs may be worth considering if:
There are a lot of homes for sale in your area
Your house has been sitting on the market longer than expected
You’ve had showings, but no offers
You’re motivated to move quickly
Or you’re trying to keep a deal together during negotiations
After all, if it’s the thing that helps bring a serious buyer across the finish line, it could be well worth it.
Other Concessions You Could Offer Instead
Just remember, being flexible doesn’t mean saying “yes” to every request. It means understanding which compromises actually help you accomplish your goals. Because there are always alternatives.
Redfin suggests considering other concessions if you’re not interested in helping with closing costs, like:
A home warranty
Repair credits
Flexible closing dates, or
Leave behind appliances or furniture
The right answer depends on what buyers in your market are asking for and what matters most to you. That’s exactly why working with an experienced local agent is so important.
Bottom Line
The sellers having the most success today are the ones who understand the market has changed and are adapting to meet it where it is.
Sometimes that means negotiating on closing costs. Sometimes it means offering something else. The key is knowing which concessions are worth it for our local market.
If you’re wondering what’s normal in our area, what’s worth negotiating, and where it makes sense to stand firm, let’s connect.
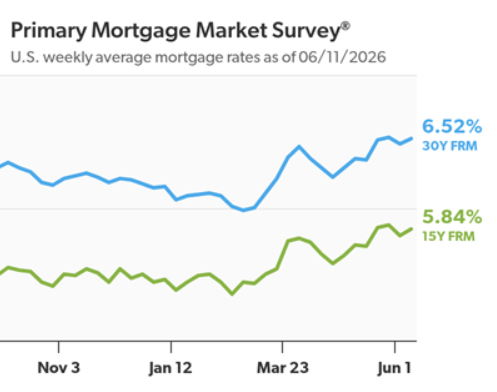
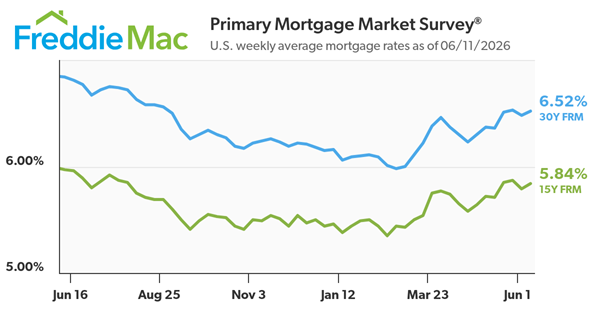
“The 30-year fixed-rate mortgage averaged 6.52% this week,” said Sam Khater, Freddie Mac’s Chief Economist. “Stronger employment momentum has helped existing home sales reach a five-month high. Importantly, we’re seeing homebuyers look past the short-term rate fluctuations and actively enter the market, signaling renewed confidence in homeownership opportunities.”
The 30-year FRM averaged 6.52% as of June 11, 2026, up from last week when it averaged 6.48%. A year ago at this time, the 30-year FRM averaged 6.84%.
The 15-year FRM averaged 5.84%, up from last week when it averaged 5.79%. A year ago at this time, the 15-year FRM averaged 5.97%.
The PMMS® is focused on conventional, conforming, fully amortizing home purchase loans for borrowers who put 20% down and have excellent credit.
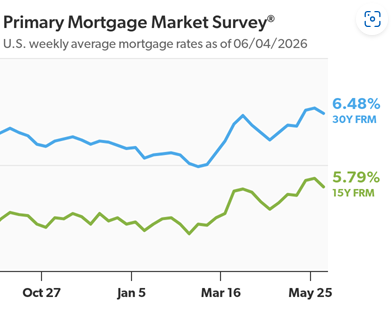
“The 30-year fixed-rate mortgage decreased to 6.48% this week,” said Sam Khater, Freddie Mac’s Chief Economist. “With mortgage rates in the mid-6% range and income growth outpacing home price growth, housing affordability is marginally improving.”
The 30-year FRM averaged 6.48% as of June 4, 2026, down from last week when it averaged 6.53%. A year ago at this time, the 30-year FRM averaged 6.85%.
The 15-year FRM averaged 5.79%, down from last week when it averaged 5.87%. A year ago at this time, the 15-year FRM averaged 5.99%.
The PMMS® is focused on conventional, conforming, fully amortizing home purchase loans for borrowers who put 20% down and have excellent credit.


 Facebook
 X
X
 Pinterest
 Copy Link