

 Facebook
 X
X
 Pinterest
 Copy Link

All •
June 8, 2023
After Three Weeks of Increases, A Decline

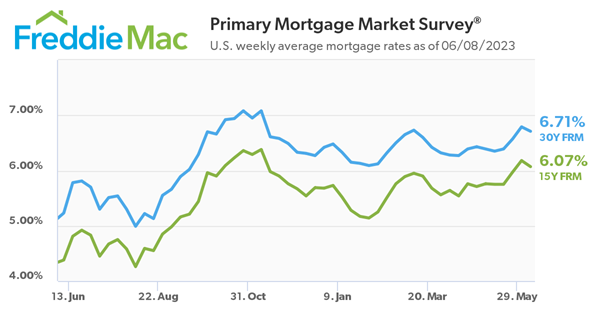
Freddie Mac today released the results of its Primary Mortgage Market Survey, showing the 30-year fixed-rate mortgage (FRM) averaged 6.71 percent.
“Mortgage rates decreased after a three-week climb,” said Sam Khater, Freddie Mac’s Chief Economist. “While elevated rates and other affordability challenges remain, inventory continues to be the biggest obstacle for prospective homebuyers.”
News Facts
- 30-year fixed-rate mortgage averaged 6.71 percent as of June 8, 2023, down from last week when it averaged 6.79 percent. A year ago at this time, the 30-year FRM averaged 5.23 percent.
- 15-year fixed-rate mortgage averaged 6.07 percent, down from last week when it averaged 6.18 percent. A year ago at this time, the 15-year FRM averaged 4.38 percent.
The PMMS is focused on conventional, conforming, fully amortizing home purchase loans for borrowers who put 20 percent down and have excellent credit.
For more information on daily interest rate movements you can check with your mortgage lender. You may also find daily mortgage interest change information online at sites such as Mortgage News Daily.
Why Is This Real Estate Market The Strongest of Our Life Time?

When you look at the numbers today, the one thing that stands out is the strength of this housing market. We can see this is one of the most foundationally strong housing markets of our lifetime – if not the strongest housing market of our lifetime. Here are two fundamentals that prove this point.
1. The Current Mortgage Rate on Existing Mortgages
First, let’s look at the current rate on existing mortgages. According to the Federal Housing Finance Agency (FHFA), as of the fourth quarter of last year, over 80% of existing mortgages have a rate below 5%. That’s significant. And, to take that one step further, over 50% of mortgages have a rate below 4% (see graph below):
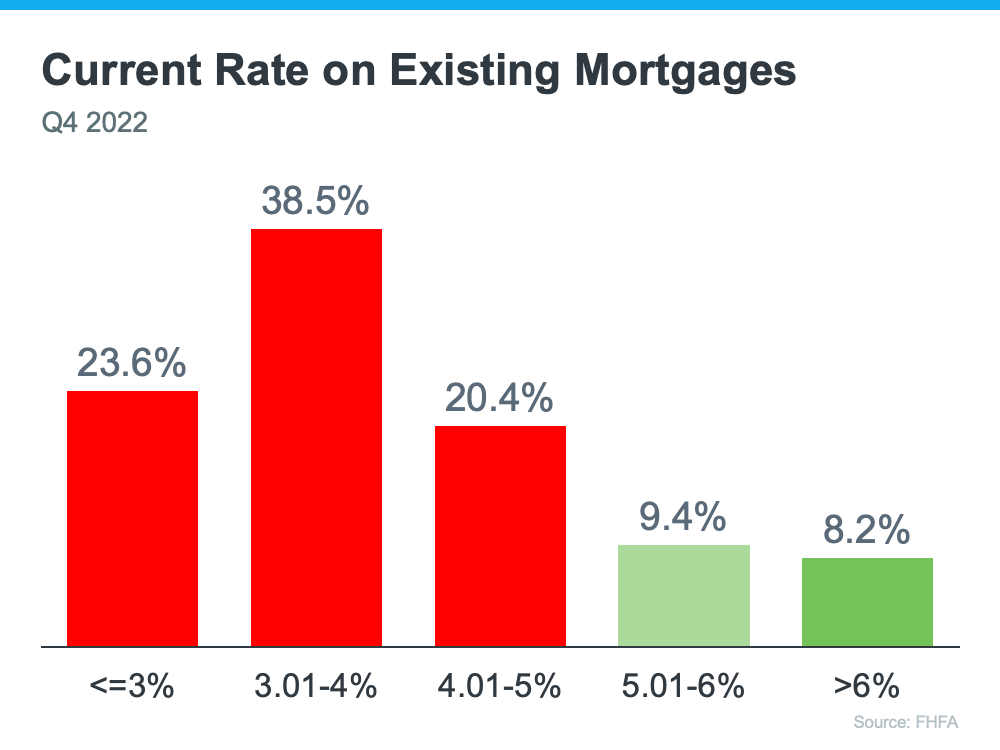
Now, there’s a lot of talk in the media about a potential foreclosure crisis or a rise of homeowners defaulting on their loans, but consider this. Homeowners with such good mortgage rates are going to work as hard as they can to keep that mortgage and stay in their homes. That’s because they can’t go out and buy another house, or even rent an apartment, and pay what they do today. Their current mortgage payment is more affordable. Even if they downsize, with today’s higher mortgage rates, it could cost more.
Here’s why this gives the housing market such a solid foundation today. Having so many homeowners with such low mortgage rates helps us avoid a crisis with a flood of foreclosures coming to market like there was back in 2008.
2. The Amount of Homeowner Equity
Second, Americans are sitting on tremendous equity right now. According to the Census and ATTOM, roughly two-thirds (around 68%) of homeowners have either paid off their mortgage or have at least 50% equity (see chart below):
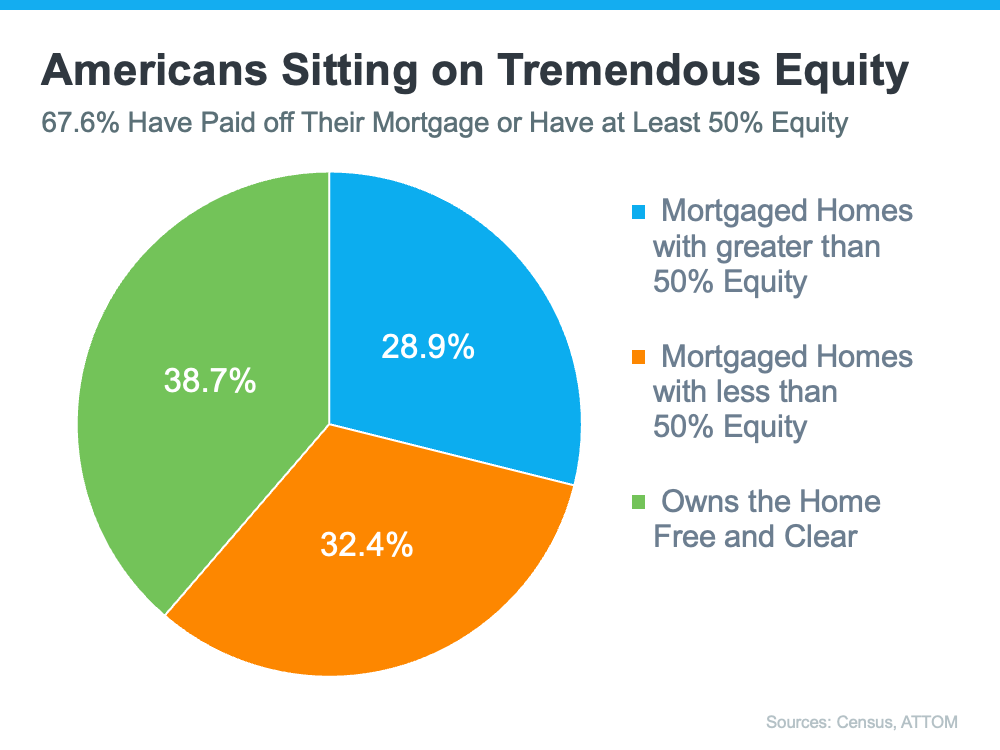
In the industry, the term for this is equity rich. This is significant because if you think back to 2008, some people had to make the difficult decision to walk away from their homes because they owed more on the home than it was worth.
But this time, things are different because homeowners have built up so much equity over the past few years alone. And, when homeowners have that much equity, it helps us avoid another wave of distressed properties coming onto the market like we saw during the crash. It also creates an extremely strong foundation for today’s housing market.
Bottom Line
We are in one of the most foundationally strong housing markets of our lifetime because homeowners are going to fight to keep their current mortgage rate and they have a tremendous amount of equity. This is yet another reason things are fundamentally different than in 2008.
Why Are Mortgage Rates High Now?
The Main Reason Mortgage Rates Are So High
Today’s mortgage rates are top-of-mind for many homebuyers right now. As a result, if you’re thinking about buying for the first time or selling your current house to move into a home that better fits your needs, you may be asking yourself these two questions:
- Why Are Mortgage Rates So High?
- When Will Rates Go Back Down?
Here’s context you need to help answer those questions.
1. Why Are Mortgage Rates So High?
The 30-year fixed-rate mortgage is largely influenced by the supply and demand for mortgage-backed securities (MBS). According to Investopedia:
“Mortgage-backed securities (MBS) are investment products similar to bonds. Each MBS consists of a bundle of home loans and other real estate debt bought from the banks that issued them . . . The investor who buys a mortgage-backed security is essentially lending money to home buyers.”
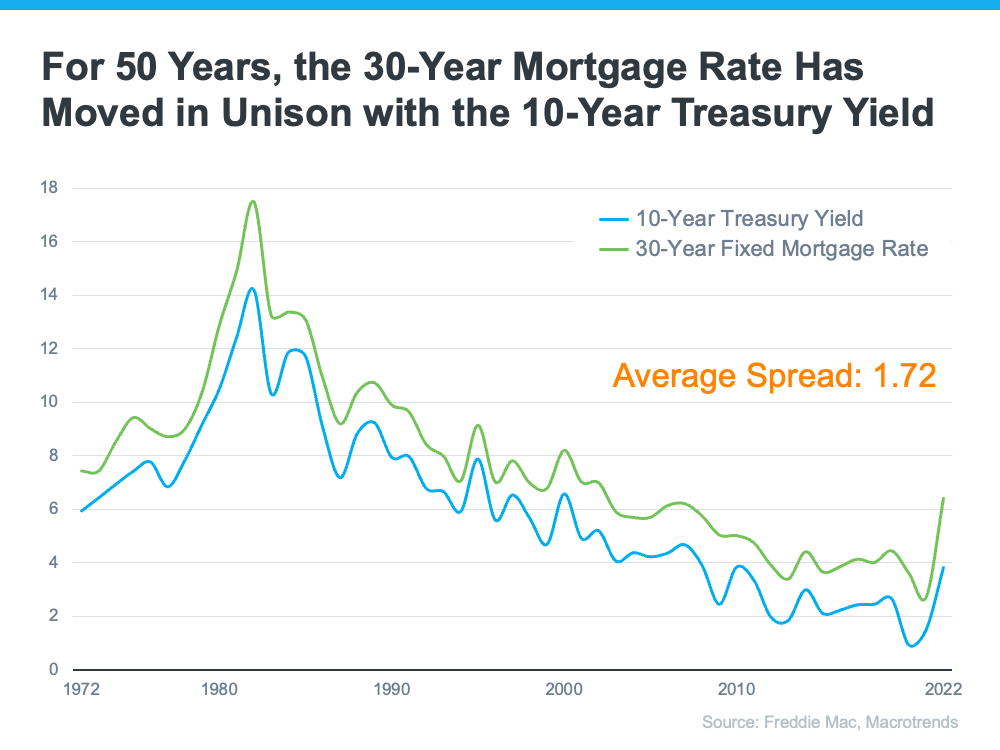
Demand for MBS helps determine the spread between the 10-Year Treasury Yield and the 30-year fixed mortgage rate. Historically, the average spread between the two is 1.72 (see chart below):
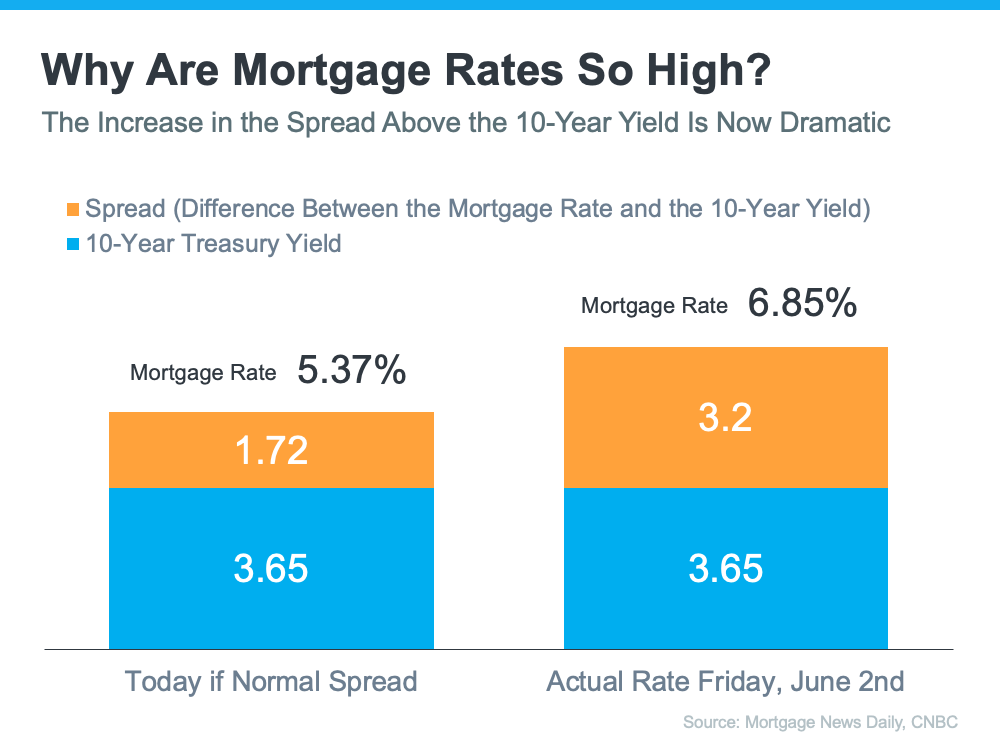
Last Friday morning, the mortgage rate was 6.85%. That means the spread was 3.2%, which is almost 1.5% over the norm. If the spread was at its historical average, mortgage rates would be 5.37% (3.65% 10-Year Treasury Yield + 1.72 spread).
This large spread is very unusual. As George Ratiu, Chief Economist at Keeping Current Matters (KCM), explains:
“The only times the spread approached or exceeded 300 basis points were during periods of high inflation or economic volatility, like those seen in the early 1980s or the Great Financial Crisis of 2008-09.”
The graph below uses historical data to help illustrate this point by showing the few times the spread has increased to 300 basis points or more:
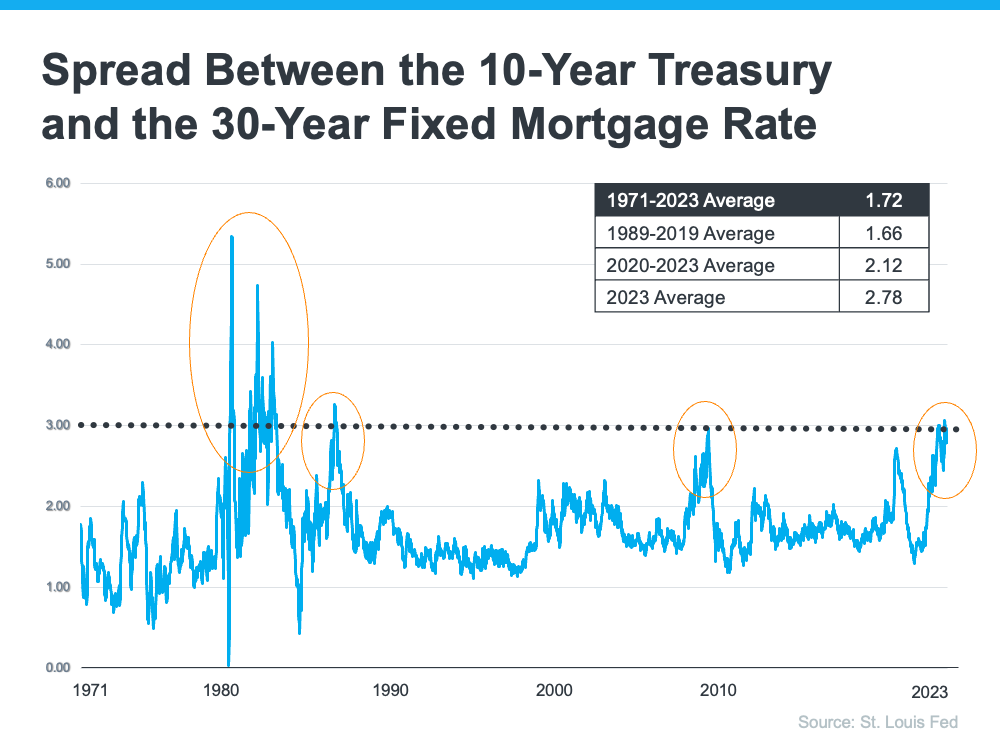
The graph shows how the spread has come down after each peak. The good news is, that means there’s room for mortgage rates to improve today.
So, what’s causing the larger spread and making mortgage rates so high today?
The demand for MBS is heavily influenced by the risks associated with investing in them. Today, that risk is impacted by broader market conditions like inflation and fear of a potential recession, the Fed’s interest rate hikes to try to bring down inflation, headlines that create unnecessarily negative narratives about home prices, and more.
Simply put: when there’s less risk, demand for MBS is high, so mortgage rates will be lower. On the other hand, if there’s more risk with MBS, demand for MBS will be low, and we’ll see higher mortgage rates as a result. Currently, demand for MBS is low, so mortgage rates are high.
2. When Will Rates Go Back Down?
Odeta Kushi, Deputy Chief Economist at First American, answers that question in a recent blog:
“It’s reasonable to assume that the spread and, therefore, mortgage rates will retreat in the second half of the year if the Fed takes its foot off the monetary tightening pedal and provides investors with more certainty. However, it’s unlikely that the spread will return to its historical average of 170 basis points, as some risks are here to stay.”
Bottom Line
The spread will shrink when the fear investors feel is eased. That’ll mean we should see mortgage rates moderate as the year goes on. However, when it comes to forecasting mortgage rates, no one can know for sure exactly what will happen.
Home Prices Didn’t Crash After All
During the fourth quarter of last year, many housing experts predicted home prices were going to crash this year. Here are a few of those forecasts:
Jeremy Siegel, Russell E. Palmer Professor Emeritus of Finance at the Wharton School of Business:
“I expect housing prices fall 10% to 15%, and the housing prices are accelerating on the downside.”
Mark Zandi, Chief Economist at Moody’s Analytics:
“Buckle in. Assuming rates remain near their current 6.5% and the economy skirts recession, then national house prices will fall almost 10% peak-to-trough. Most of those declines will happen sooner rather than later. And house prices will fall 20% if there is a typical recession.”
“Housing is already cooling in the U.S., according to July data that was reported last week. As interest rates climb steadily higher, Goldman Sachs Research’s G-10 home price model suggests home prices will decline by around 5% to 10% from the peak in the U.S. . . . Economists at Goldman Sachs Research say there are risks that housing markets could decline more than their model suggests.”
The Bad News: It Rattled Consumer Confidence
These forecasts put doubt in the minds of many consumers about the strength of the residential real estate market. Evidence of this can be seen in the December Consumer Confidence Survey from Fannie Mae. It showed a larger percentage of Americans believed home prices would fall over the next 12 months than in any other December in the history of the survey (see graph below). That caused people to hesitate about their homebuying or selling plans as we entered the new year.
The Good News: Home Prices Never Crashed
However, home prices didn’t come crashing down and seem to be already rebounding from the minimal depreciation experienced over the last several months.
In a report just released, Goldman Sachs explained:
“The global housing market seems to be stabilizing faster than expected despite months of rising mortgage rates, according to Goldman Sachs Research. House prices are defying expectations and are rising in major economies such as the U.S.,. . . ”
Those claims from Goldman Sachs were verified by the release last week of two indexes on home prices: Case-Shiller and the FHFA. Here are the numbers each reported:
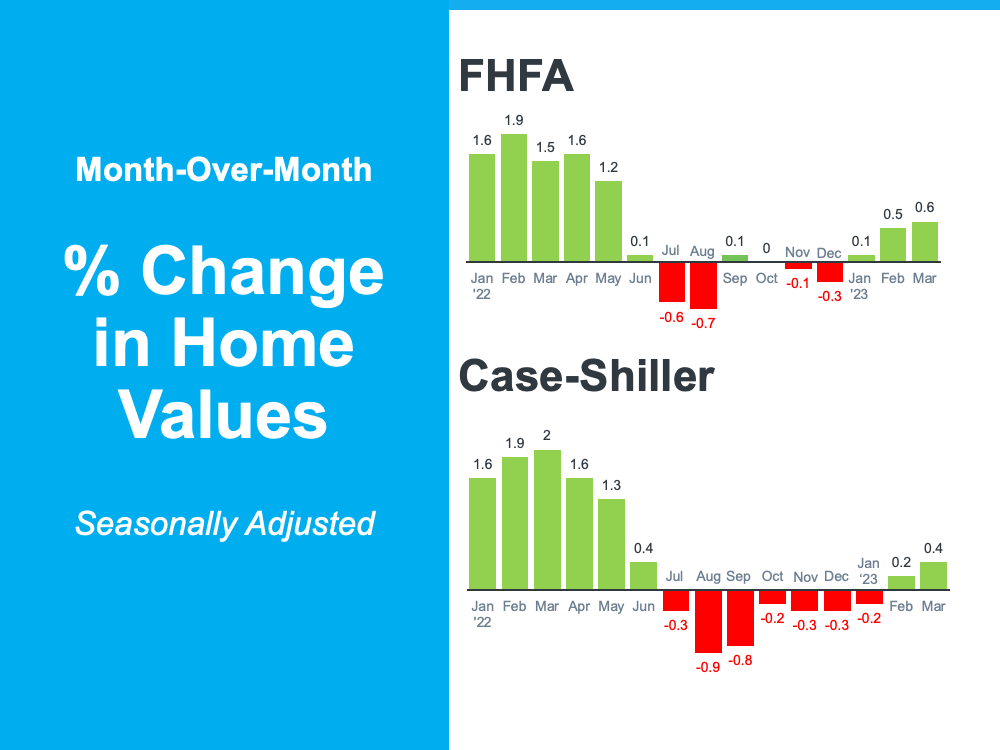
Home values seem to have turned the corner and are headed back up.
Bottom Line
When the forecasts of significant home price depreciation were made last fall, they were made with megaphones. Mass media outlets, industry newspapers, and podcasts all broadcasted the news of an eminent crash in prices.
Now, forecasters are saying the worst is over and it wasn’t anywhere near as bad as they originally projected. However, they are whispering the news instead of using megaphones. As real estate professionals, it is our responsibility – some may say duty – to correct this narrative in the minds of the American consumer.

Buying •
June 2, 2023
Reasons To Own Your Home


Some Highlights
- June is National Homeownership Month, and it’s a perfect time to think about all the benefits that come with owning your home.
- Owning a home not only makes you feel proud and accomplished, but it’s also a big step toward having a secure and stable financial future.
- Are you ready to enjoy all the amazing advantages that come with owning a home? Let’s get in touch to start the process today.
All •
June 1, 2023
Mortgage Rates Up This Week

Freddie Mac today released the results of its Primary Mortgage Market Survey® (PMMS®), showing the 30-year fixed-rate mortgage (FRM) averaged 6.79 percent.
“Mortgage rates jumped this week, as a buoyant economy has prompted the market to price-in the likelihood of another Federal Reserve rate hike,” said Sam Khater, Freddie Mac’s Chief Economist. “Although there has been a steady flow of purchase demand around rates in the low to mid six percent range, that demand is likely to weaken as rates approach seven percent.”

- 30-year fixed-rate mortgage averaged 6.79 percent as of June 1, 2023, up from last week when it averaged 6.57 percent. A year ago at this time, the 30-year FRM averaged 5.09 percent.
- 15-year fixed-rate mortgage averaged 6.18 percent, up from last week when it averaged 5.97 percent. A year ago at this time, the 15-year FRM averaged 4.32 percent.
The PMMS® is focused on conventional, conforming, fully amortizing home purchase loans for borrowers who put 20 percent down and have excellent credit.
Check with your mortgage lender for information on daily interest rate movements. You can also search online for daily mortgage interest information on sites such as Mortgage News Daily.
All •
June 1, 2023
Have The ‘Unicorns’ Have Galloped Off?

Comparing real estate metrics from one year to another can be challenging in a normal housing market. That’s due to possible variability in the market making the comparison less meaningful or accurate. Unpredictable events can have a significant impact on the circumstances and outcomes being compared.
Comparing this year’s numbers to the two ‘unicorn’ years we just experienced is almost worthless. By ‘unicorn,’ this is the less common definition of the word:
“Something that is greatly desired but difficult or impossible to find.”
The pandemic profoundly changed real estate over the last few years. The demand for a home of our own skyrocketed, and people needed a home office and big backyard.
- Waves of first-time and second-home buyers entered the market.
- Already low mortgage rates were driven to historic lows.
- The forbearance plan all but eliminated foreclosures.
- Home values reached appreciation levels never seen before.
It was a market that forever had been “greatly desired but difficult or impossible to find.” A ‘unicorn’ year.
Now, things are getting back to normal. The ‘unicorns’ have galloped off.
Comparing today’s market to those years makes no sense. Here are three examples:
Buyer Demand
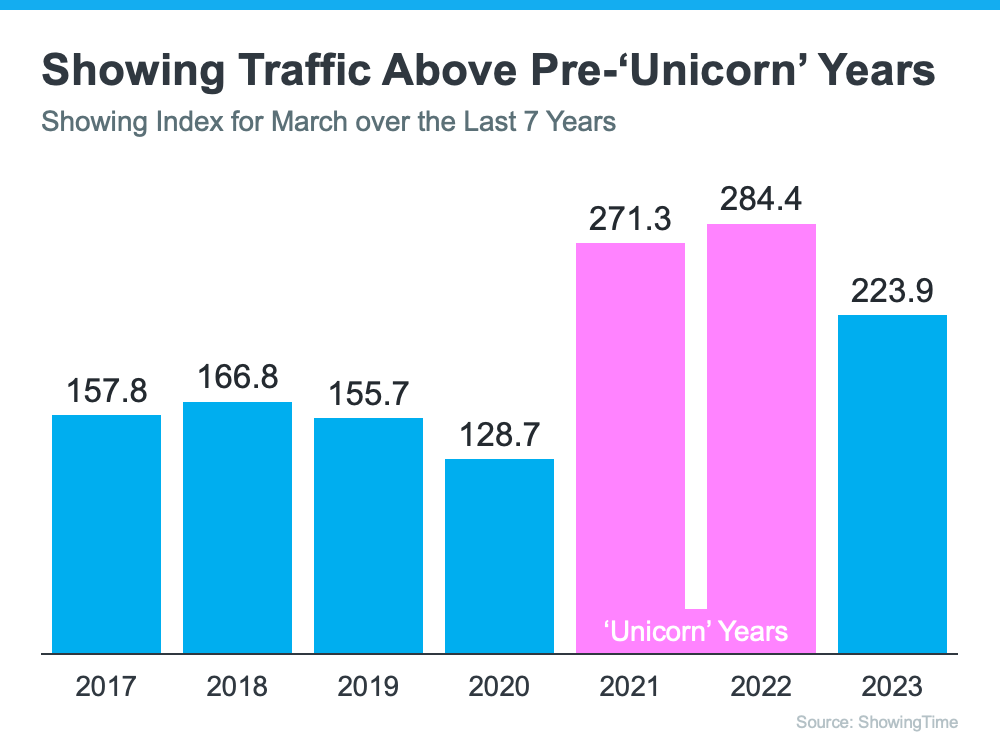
If you look at the headlines, you’d think there aren’t any buyers out there. We still sell over 10,000 houses a day in the United States. Of course, buyer demand is down from the two ‘unicorn’ years. But, according to ShowingTime, if we compare it to normal years (2017-2019), we can see that buyer activity is still strong (see graph below):
Home Prices
We can’t compare today’s home price increases to the last couple of years. According to Freddie Mac, 2020 and 2021 each had historic appreciation numbers. Here’s a graph also showing the more normal years (2017-2019):
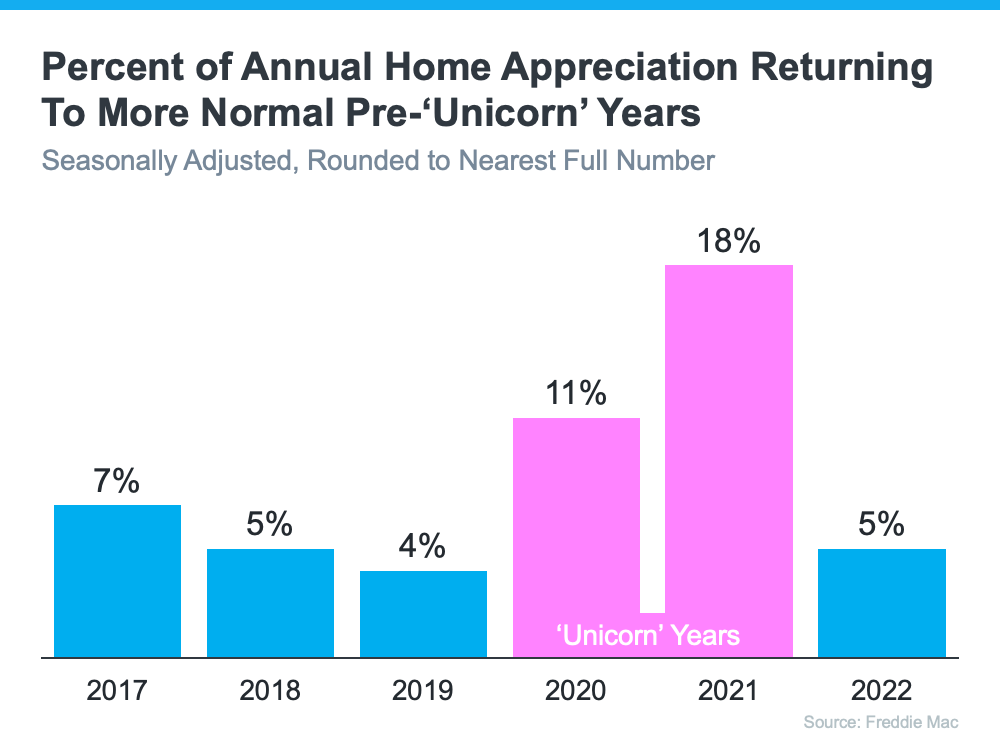
We can see that we’re returning to more normal home value increases. There were several months of minimal depreciation in the second half of 2022. However, according to Fannie Mae, the market has returned to more normal appreciation in the first quarter of this year.
Foreclosures
There have already been some startling headlines about the percentage increases in foreclosure filings. Of course, the percentages will be up. They are increases over historically low foreclosure rates. Here’s a graph with information from ATTOM, a property data provider:
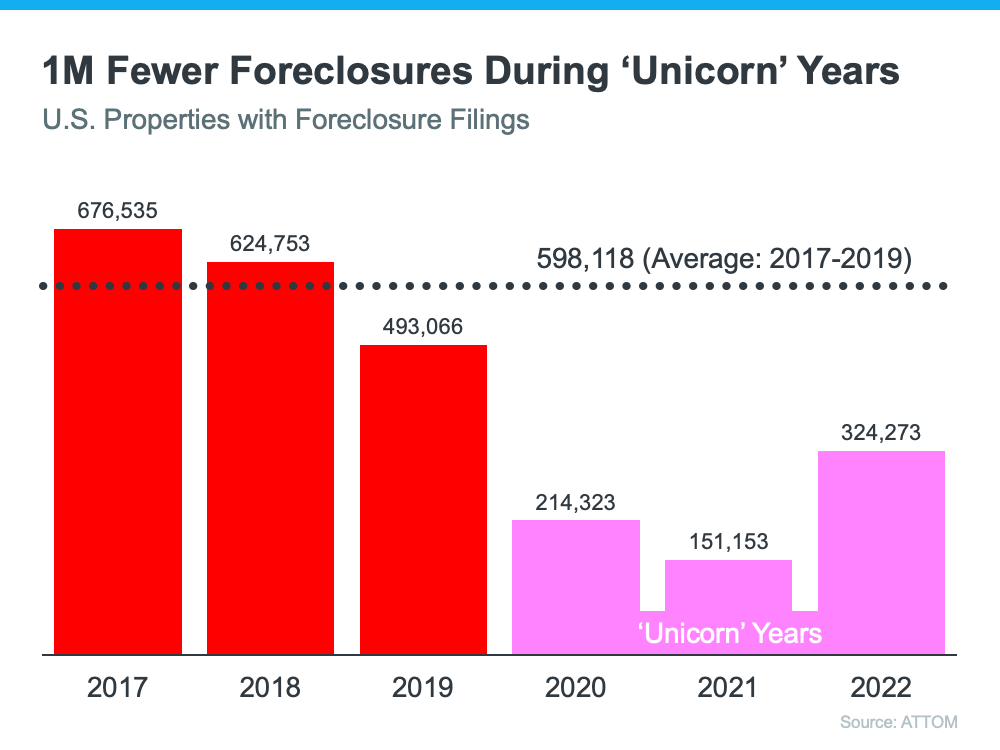
There will be an increase over the numbers of the last three years now that the moratorium on foreclosures has ended. There are homeowners who lose their home to foreclosure every year, and it’s heartbreaking for those families. But, if we put the current numbers into perspective, we’ll realize that we’re actually going back to the normal filings from 2017-2019.
Bottom Line
There will be very unsettling headlines around the housing market this year. Most will come from inappropriate comparisons to the ‘unicorn’ years. Let’s connect so you have an expert on your side to help you keep everything in proper perspective.


